You are here: Home1 / Exclusive Strategies
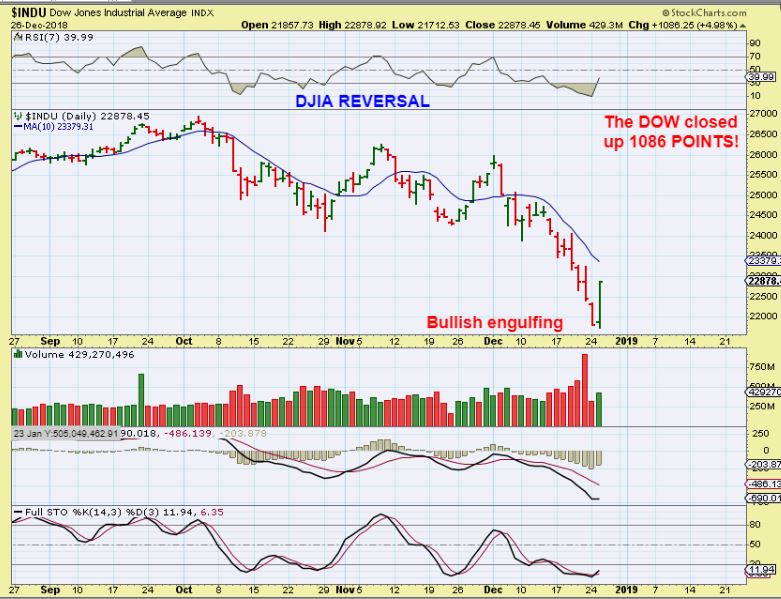
The DJIA was up over 1000 points yesterday! Now that's a bounce, in fact, I believe that it was the largest up day in the DJIA....Ever. I want to review what I mentioned in my last report. I had about 6 charts of the General Markets, so if you need to go back and review them all, I had a few in the beginning, and a few at the close...
.
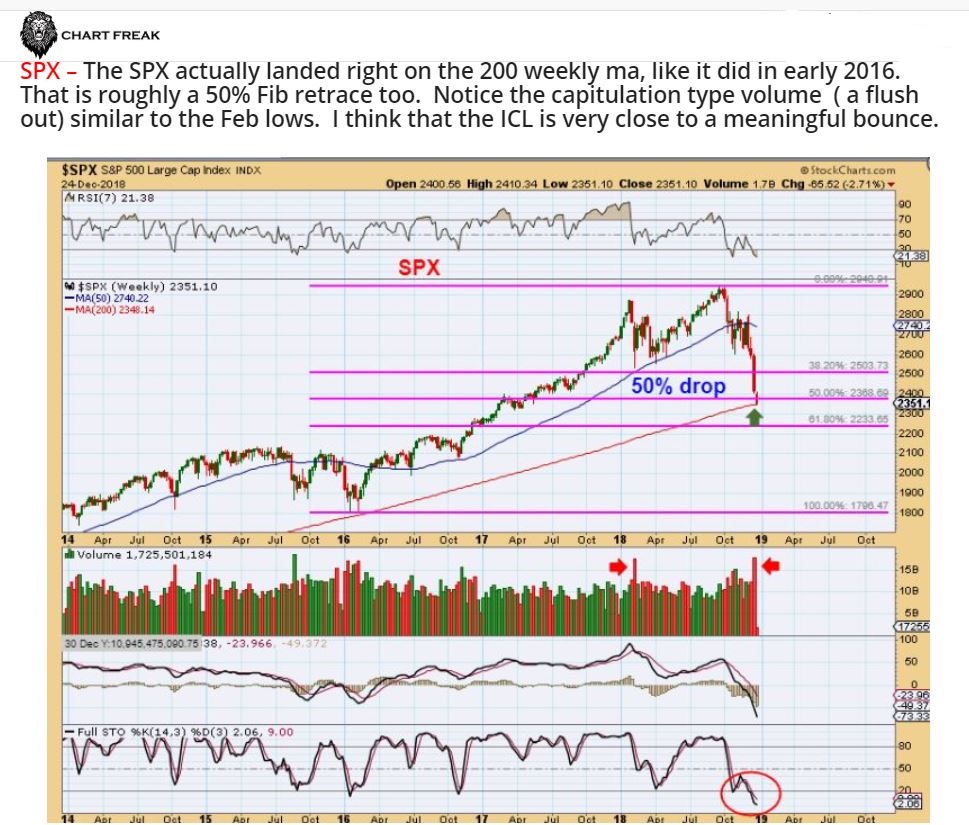
I pointed out the Capitulation type volume, 50 % Fib retrace, the 200 weekly MA, etc . and then stated...
After that SPX chart, I wrote this:
.
" When I look at the Equity Market Sentiment ( FEAR AND PANIC), and I look at the Puts Call ratio, I Look at the cycle count, the Fib #’s, The number of stocks trading below the 50 & 200sma, and a number of other things etc etc etc, it really looks like we are very close to an ICL. I will have to watch how the first 2 daily cycle play out from there, but a snap back rally seems overdue. A 1-2 month rally in the General Markets would also fit in with a pull back for Gold into the next Gold ICL."
.
Wednesday, we saw the DJIA rally up 1000 Points! - Well, that sounds pretty awesome, but it does feel like the Dow has also been giving up about 600 every few days, so is this what we have been waiting for?
Let's discuss how things seem to be LINING UP...
Read MoreMonday was only a 1/2 day of trading, and in my weekend I mentioned that I found something interesting pertaining to the Miners that I thought was important to share at this time, so I want to devote most of this report to that discussion.
Read MoreIt has been reported that past week was the worst December in 10 years for the General Markets. I am hearing that depending on how it ends this week, it could even become the worst drop for the Dow in decades.
.
This week I was thinking about the average person and their 401Ks. Why? I went to lunch with 2 friends on Thursday, and they said to me, " I saw the Dow was down 600 points! I know it'll recover, but wow, that is the 3rd time that I saw that recently. This is just normal sideways stuff, right?" Hmmm, Since October, the markets have plummeted and erased all of 2018's gains. Even though most know that the markets are shaky or 'having a rough spell' as my other friend mentioned, I just realized that most do not know that the final quarter of 2018 wiped out all of 2018 and then some. Depending on how their 401k is set up, there may be an awful lot of shock when the next quarterly statement is viewed.
I showed my friends the chart below as of Thursday on my phone and they were shocked. "I thought we were still chopping around at the highs?", my friend Danny said. Let's look at some charts....
.
SPX WEEKLY - You can see that last February -April, the sell off was steep, but this one has been 2x that drop. It is now approaching the 200 weekly ma as a possible support. This chart helped my friends to see that the last 3 months of 2018 may have wiped out their entire year of 401k gains and even half of 2017, depending on how they were set up. They were shocked and unaware, despite hearing about a few 600 point drops on the news.

Read More
Scroll to top