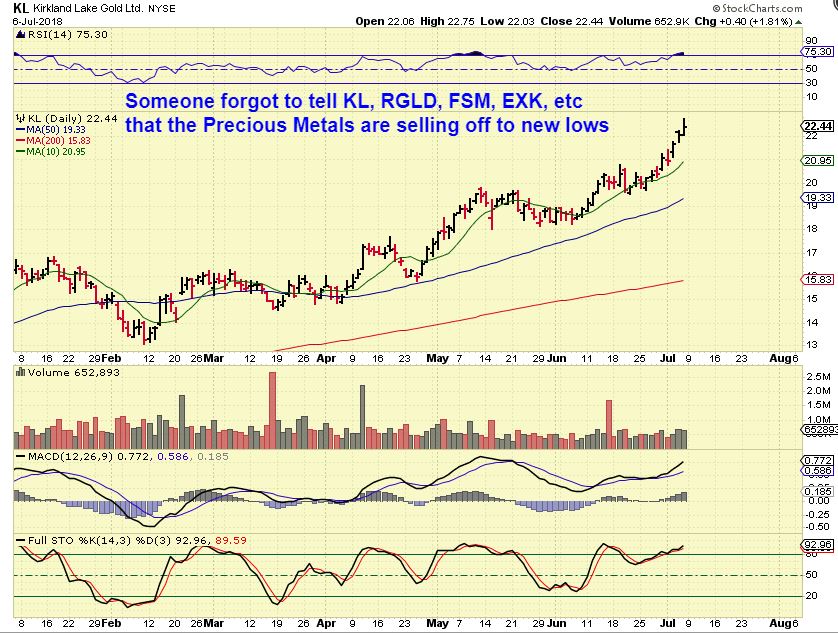
What? Huh, Oil? Who said something about Oil?
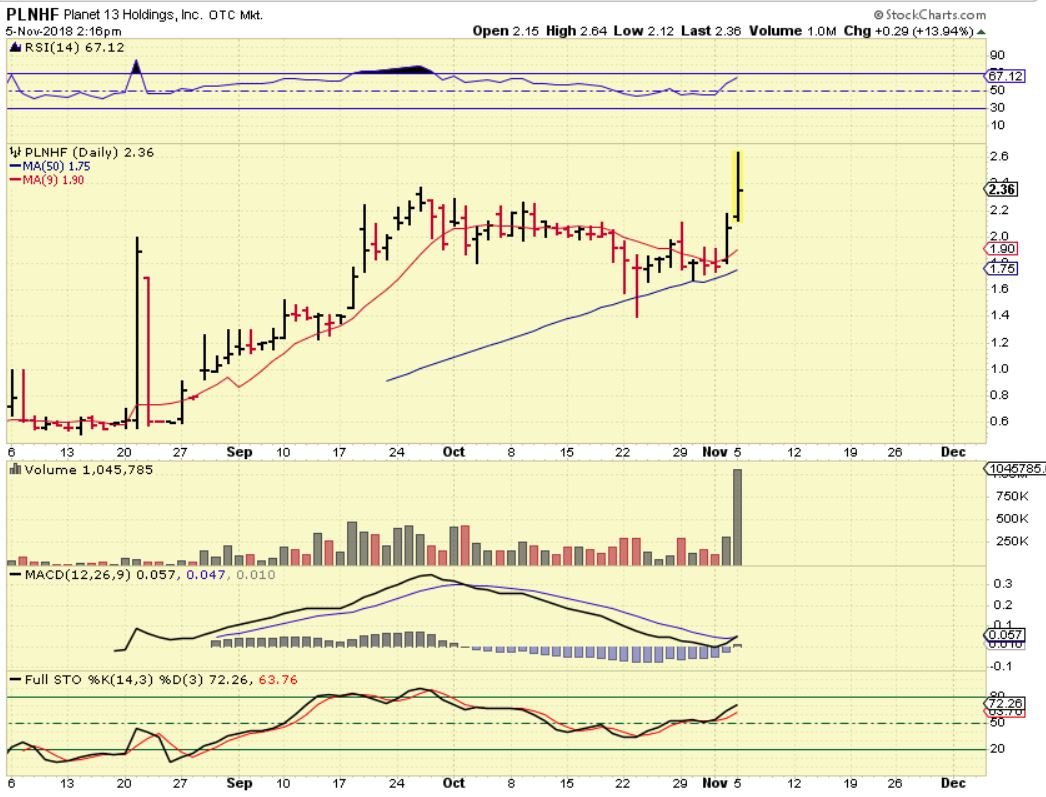
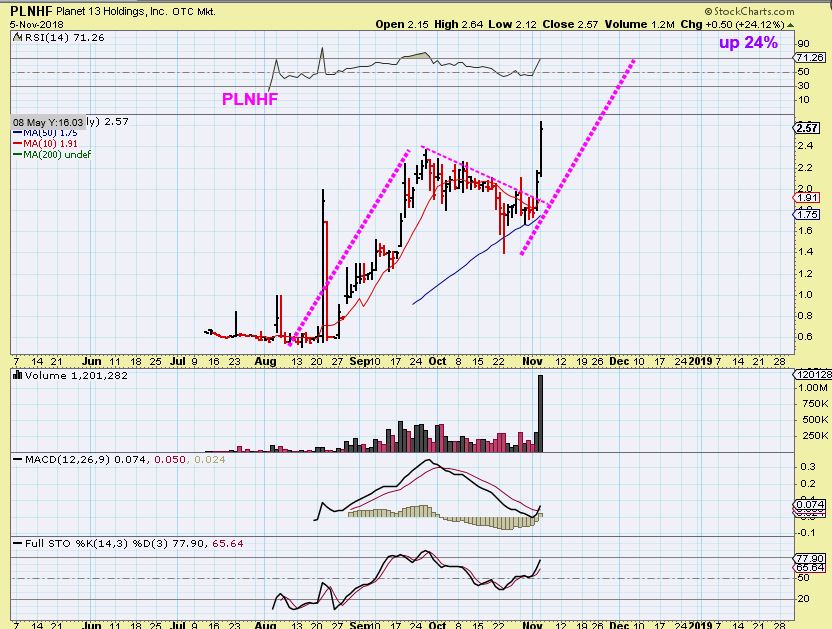
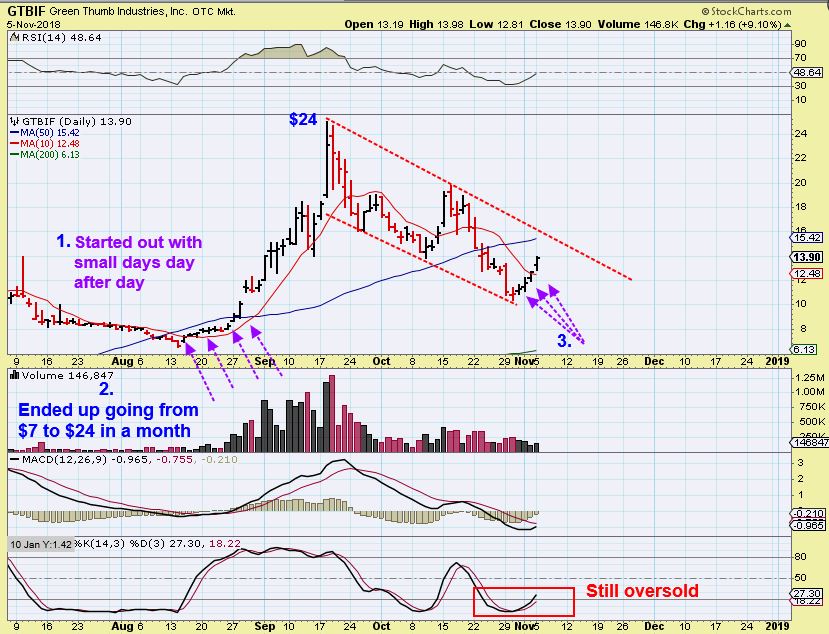
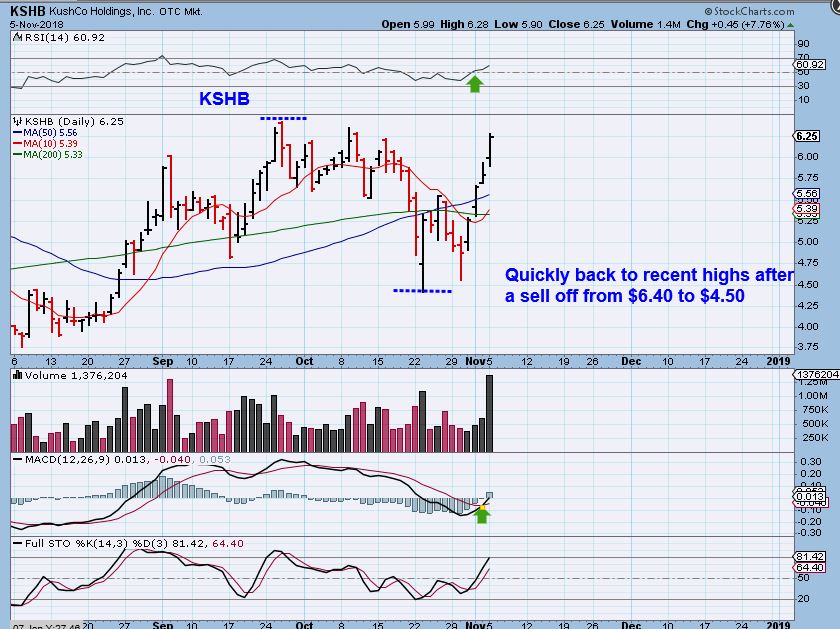
(Below is a sample of Alex’s works from the past week.)
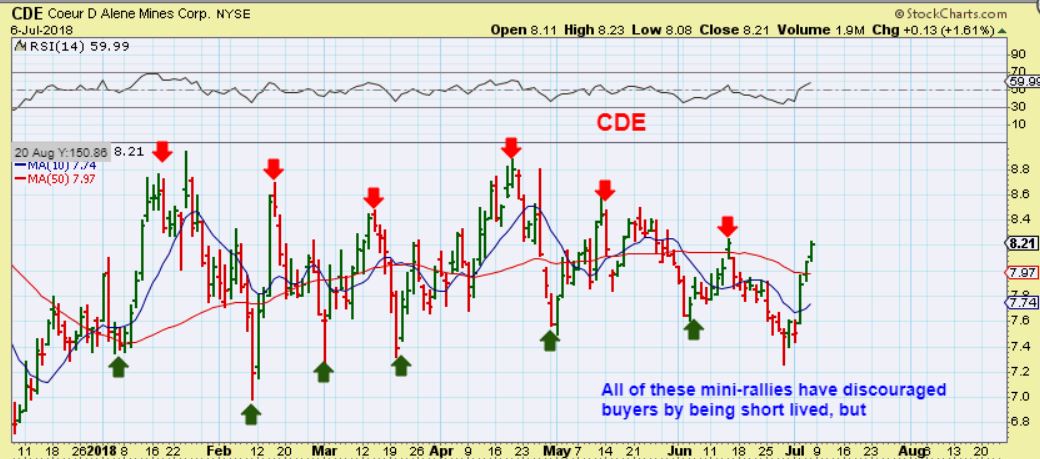
These past few weeks have been extremely frustrating for a lot of traders out there. So many are getting chopped up and setups that look promising one day, fail the next.
There is something that many traders don’t want to hear, especially ones just starting out. Sit on cash. It isn’t sexy, it isn’t going to make you any gains but it is often the BEST advice. Trading isn’t always about making money, but it is always about preserving your capital. As great as it feels to make money, it is 100 times worse to lose your money.
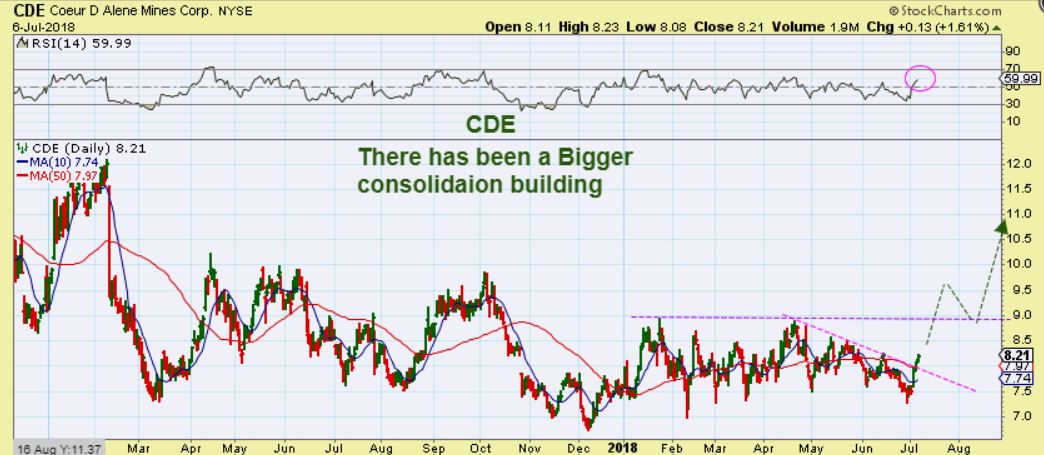
One of the old cliches in trading is “don’t try to catch a falling knife.” When a stock is falling, there is a temptation among some to try to guess the bottom. Oftentimes, this leads to buying at a price only to continue to see it fall. There are some tactics you can use to nibble around the edges, but that is for another time. Right now, we should focus on confirmation.
That leads to oil.
(From 11/14/18)
OIL ENTERED ‘FREE-FALL”, and a low should be close.
.
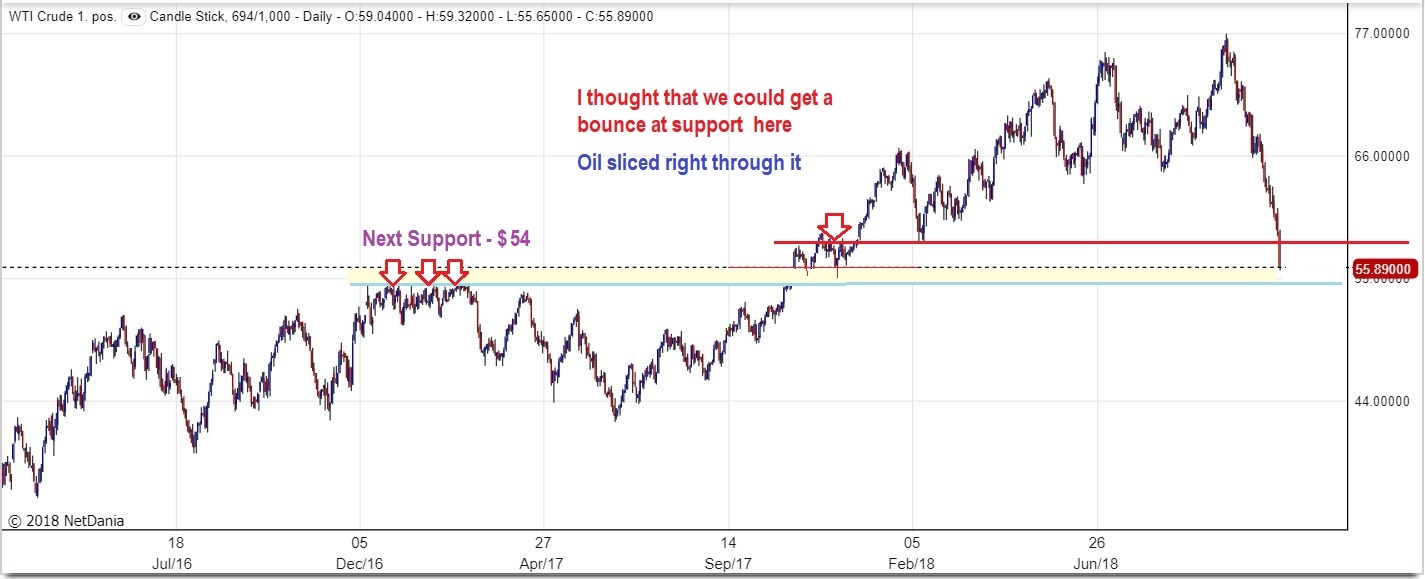
WTIC – I expected that small support area to give Oil a bounce as support, because we were on day 60, but it sliced right through it. We are over 60 days deep and this was the 12th straight day of selling. The next solid support should be $54ish. We are just about there.
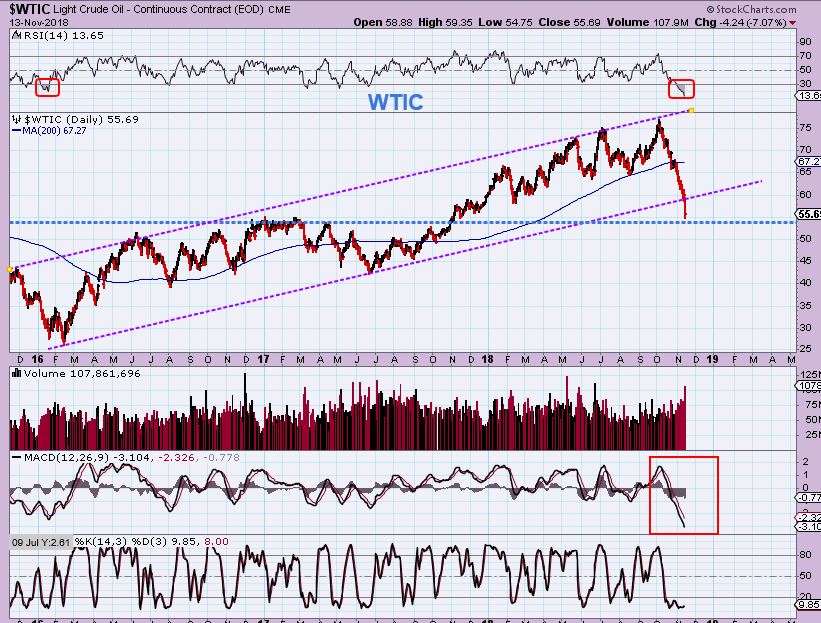
WTIC – This chart shows how oversold it is approaching that support ( but they can extend, we need a reversal).
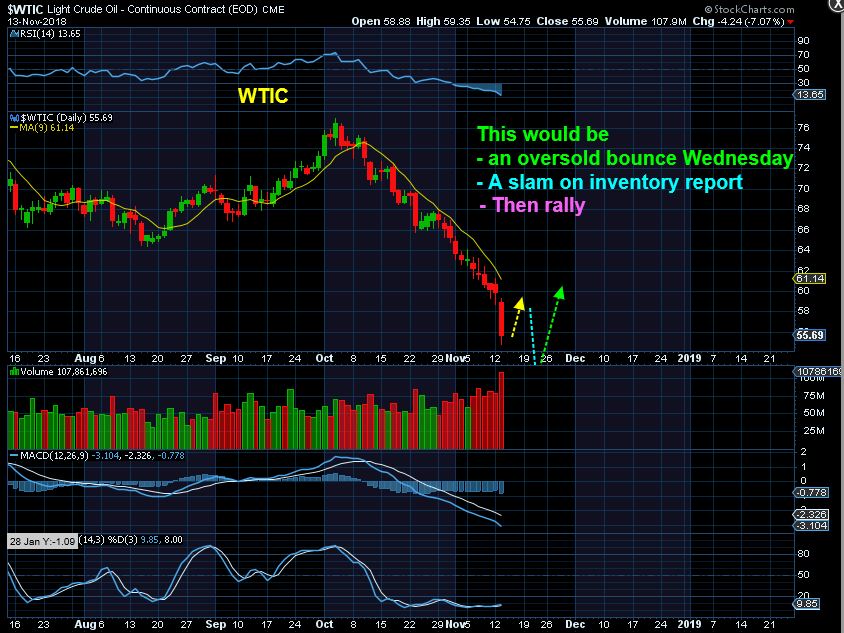
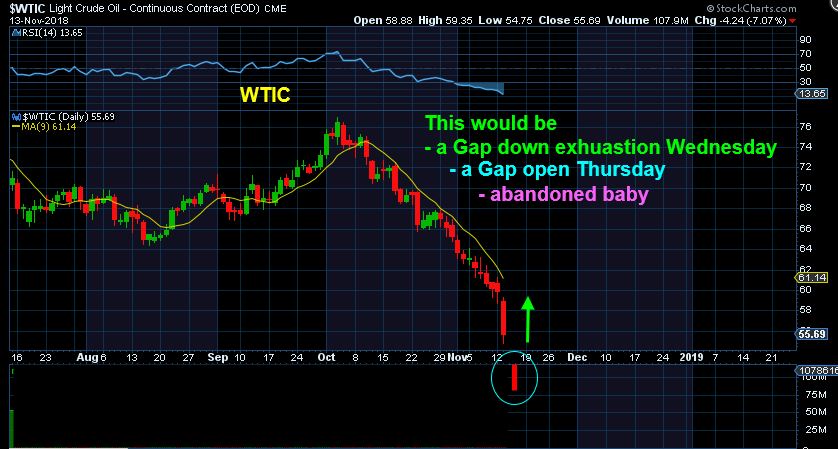
** I thought that we could see an Oil reversal at the oil inventory report. I was informed in the comments section ( thanks ‘LittleTimeLeft’) that due to the Monday Holiday in the U.S. – The Oil inventory report has moved to Thursday. I looked it up, and that is correct. So will we reverse before that report? It is hard to say, so below are 2 ideas of what we could see as Oil seeks out a low around that report over the next 2 days…
.
WTIC – We could ‘bounce’ Wednesday, and then do a final slam ‘shake out’ Thursday at the inventory report, and then rally higher.
WTIC – We could gap down Wednesday ( and even Wednesday & Thursday) and then take off higher. Oil is stretched though, so when a reversal low forms, I think it will eventually V-Bottom.
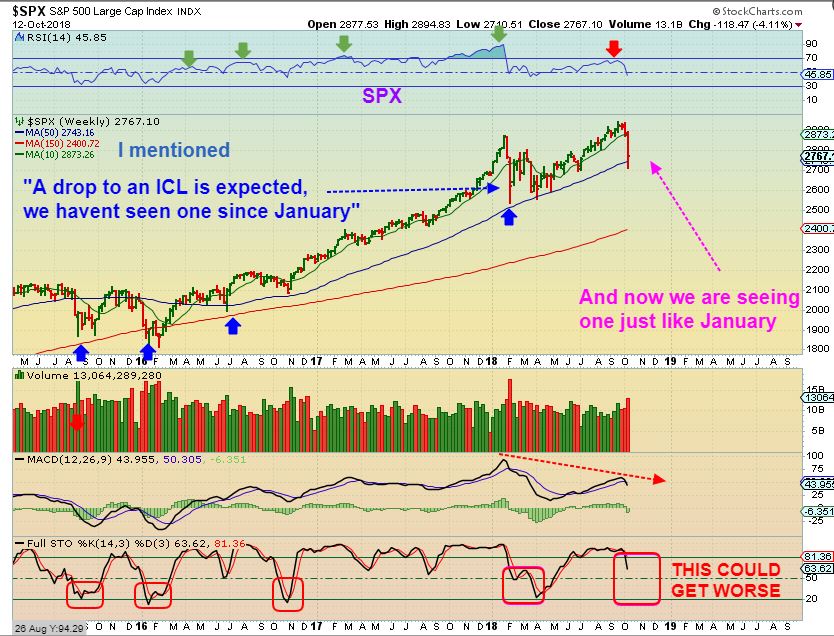
So we are looking at what I expected to be an ICL, and this has been a raging sell off, so it fits the description, but I looked back and saw something that was pretty interesting. This caught my eye…
.
WTIC – After this monster sell off in 2015, the sharp V-Bottom rally was immediate,but then it slowly stalled, went sideways , and eventually rolled over into another sell off, bringing price much lower ( Bear market). THIS WOULD BE DEFLATIONARY. Not good for Commodities, so is Oil going higher after this ICL or will it stall? If it stalls, I’d like to remember this chart.
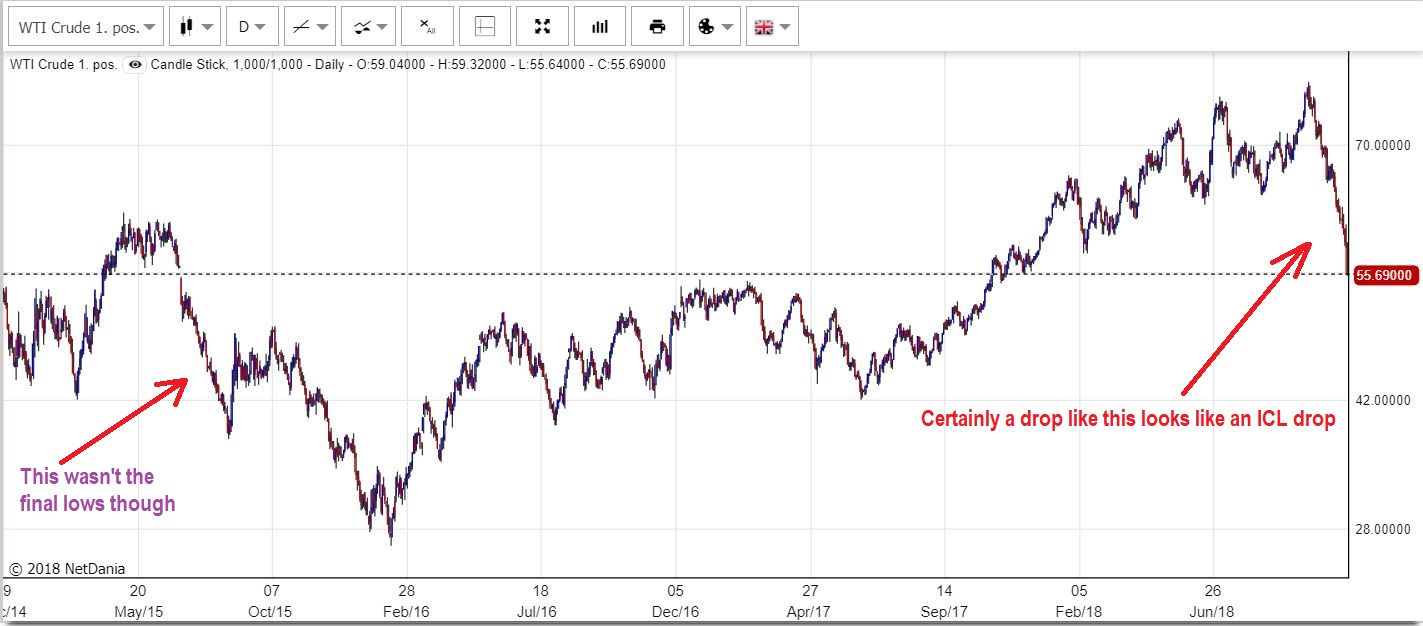
I bought DWT (Short Oil) in October around $5 & sold if for a $1 gain. It has since doubled. I sold that way too early, so If we get another drop like 2015, I will recommend DWT buy & hold for a month.
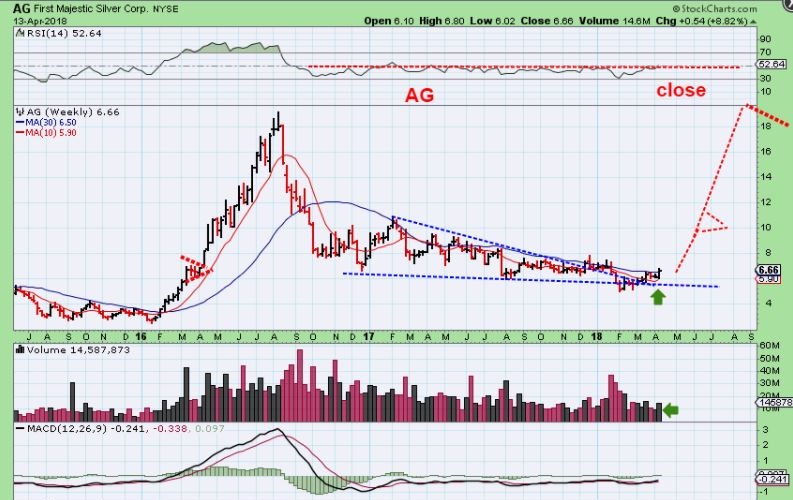
(As a brief reminder, I have been noting that Oil was likely for a big sell off. It was stronger than I had anticipated, but nonetheless, we wait for the bottom to form and could see a reversal in prices. Once price has confirmed the bottom, you can enter a position and set your stops at the lowest point. Then move them to breakeven quickly.)
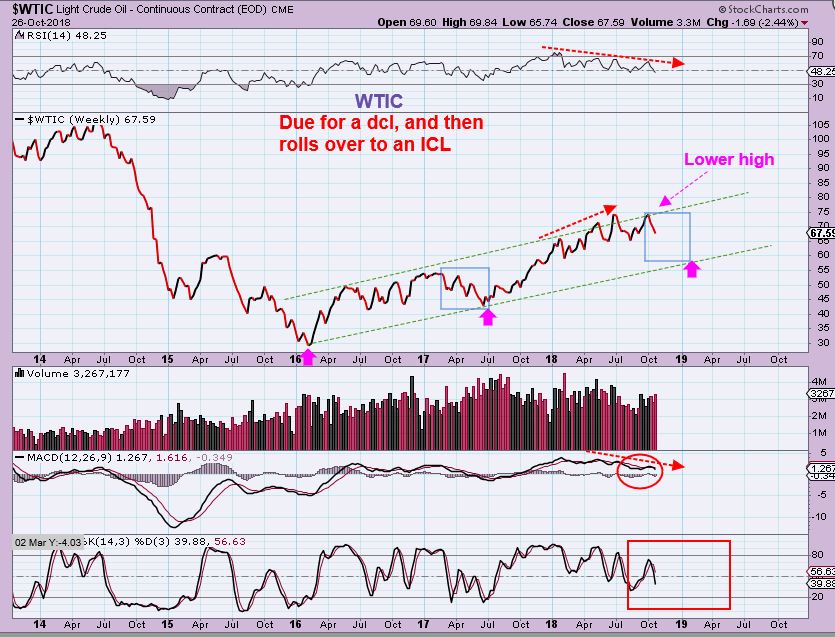
WTIC OCT 26 – Due for an ICL, This chart showed Oils was expected to drop near $60 in the Big Picture.
UWT, USO, UCO are ‘long Oil’ plays.
(From Friday 11/16/18)
WTIC – Past reports discussed the Cycle count. I looked back at OIL, and often it puts in small days at the lows, so I added to my Long position, thinking that this time it will not be a bear flag. See the chart. If we get to the 8 ema, I will sell a portion.
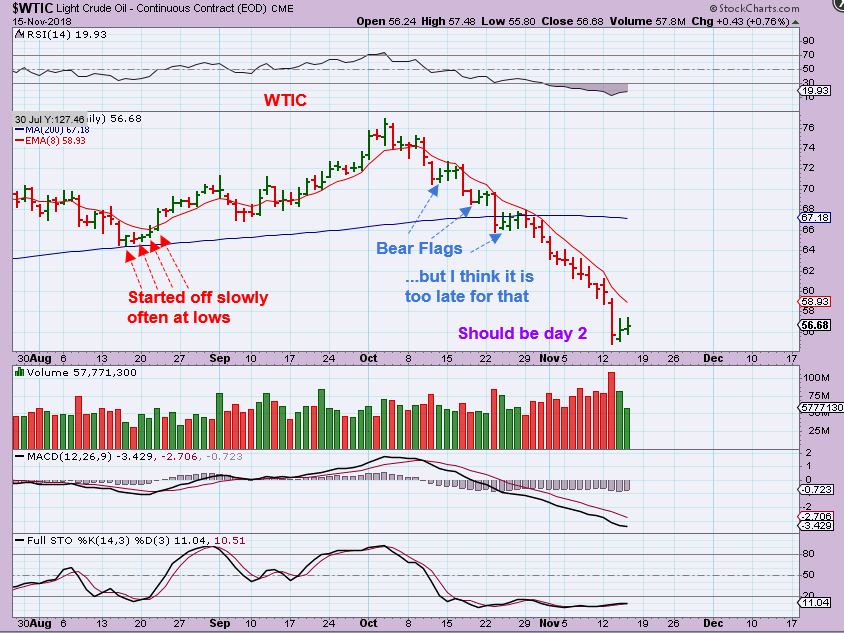
Chart Freak Membership
Alex has been successfully writing a daily newsletter service for nearly four years now and is considered one of the best traders of precious metals miners, energy/uranium stocks, and biotechs. This is your opportunity to join his service as a member and follow along as we enter the next bullish gold Cycle higher.
If you would like to find out more about the service or sign up, please click the buy option for more details.