You are here: Home1 / Premium
After avoiding the stormy waters of the sell off in October through December, we had the hope of a nice rally out of the ICL , and some good trading opportunities presented themselves. I have mentioned the importance of watching how the first daily cycle unfolds, and especially the 2nd daily cycle. Well, we have some 'things' to look at that add hope that the current gains may continue for a while longer...
.
Just yesterday I said and drew these two things about the market...
 Read More
When a Red Flag shows up on the beach, it means that for some reason, it is unsafe to swim in those waters. Well, after 3 nice weeks of gains in the Oil & Energy sector, I am still seeing a Red Flag in those waters. As mentioned in yesterdays report, Oil itself still looks fine, but it seems that some of the Oil / Energy stocks may not like the waters that they find themselves swimming in. It looks like a Red Flag to me.
Let's take a look at our markets...
.
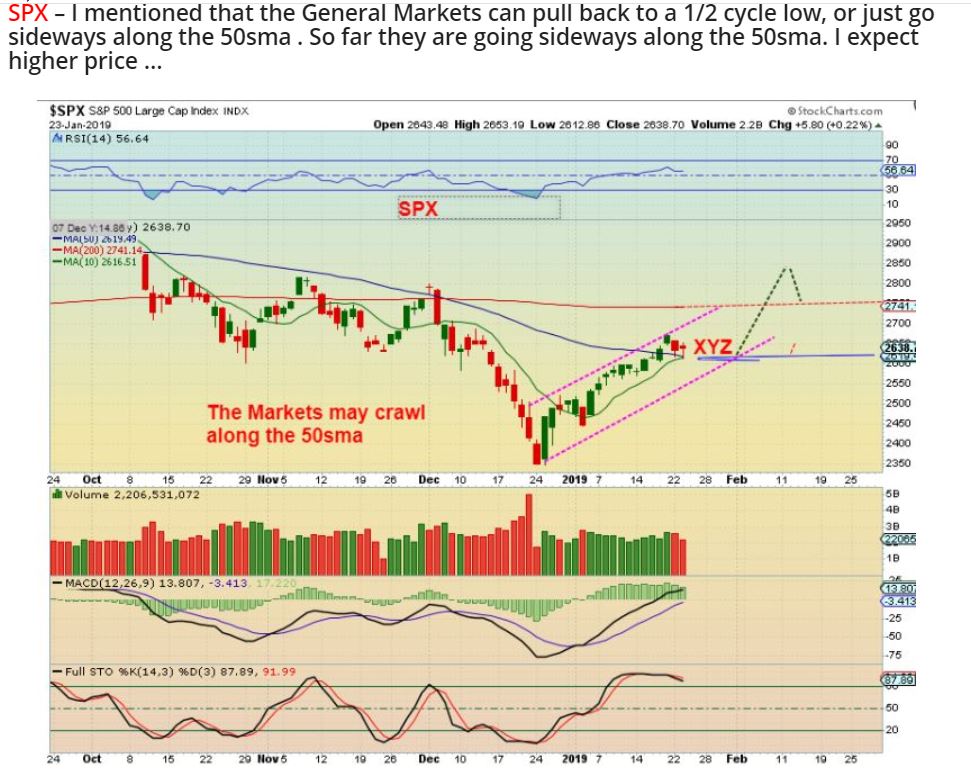
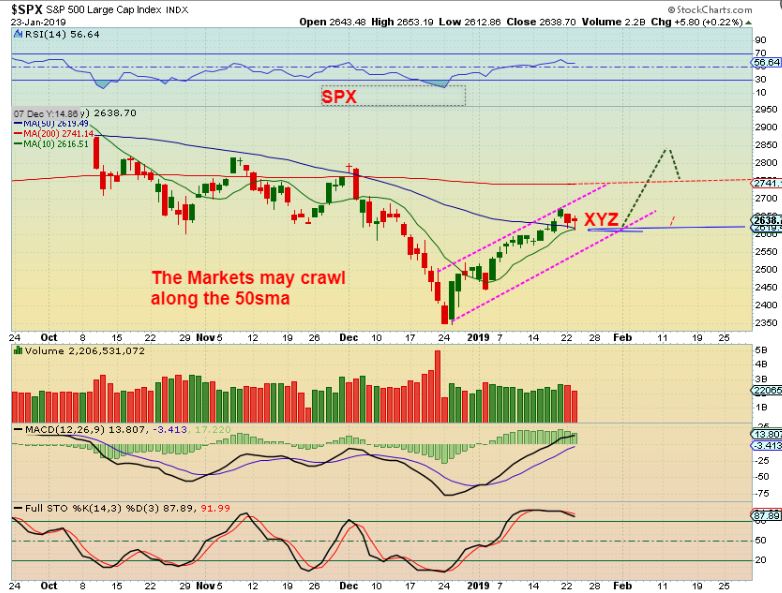
SPX - I mentioned that the General Markets can pull back to a 1/2 cycle low, or just go sideways along the 50sma . So far they are going sideways along the 50sma. I expect higher price ...
 Read More
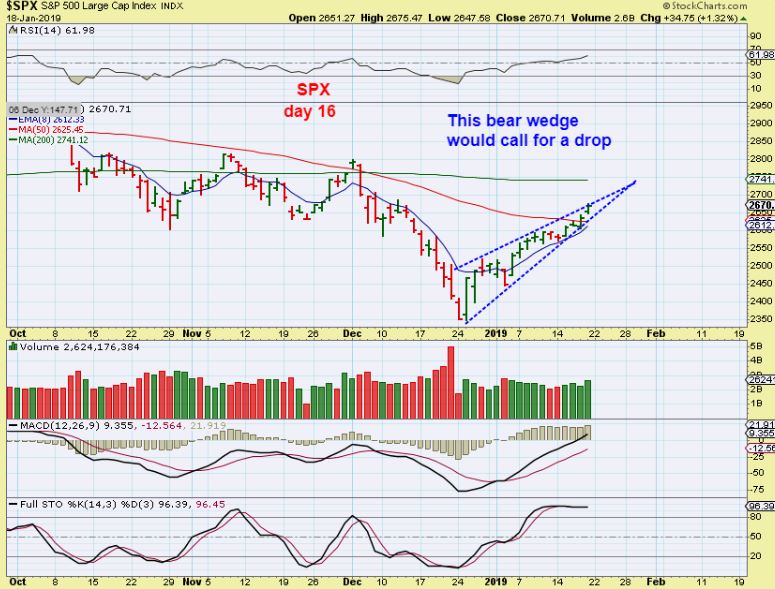
SPX - Day 17 has us in the middle of a move out of an ICL, and it is overbought. The short term move gets difficult to predict from this point, since it could dip to a 1/2 cycle low and then continue higher, or it may just churn sideways along the 50sma as it struggles in a wedge. Price held above that 50sma, but the Wedge is cautionary short term. My long term view remains the same.
Let's look a bit closer...
Read More The Big Picture Outlook is based on current information and the formation of current set ups and what they seem to indicate going forward, but they cannot be considered 'Etched In Stone'. They give us a solid idea of what we may expect in the upcoming weeks or even months, and that helps us to move forward with our trade ideas. We have currently taken some trades at Major bottoms (ICLs) in the Equity and Energy Sectors, and we have used the Big Picture set up to have confidence in those trades.
So far, everything is right on track for what that Big Picture outlook here at Chartfreak has been for the past few months. The current trades are playing out well, but as time goes on, we need to stay alert to those big Picture set ups too. Things can gradually change over time, and adjustments are also made if necessary. For example, some may raise stops, others may decide to cut leverage, or even add to current positions , depending on how things are playing out. My admonition remains that as time goes forward, we need to stay current, stay flexible or adaptable, and Stay Frosty! Yes, we want to continue to examine the markets as we watch and see how things unfold.
.
That said, Let's examine our current Big Picture Market set ups. I am noting one change in the Precious Metals sector that needs to be mentioned and monitored going forward.
.
I said this in Friday Mornings report:
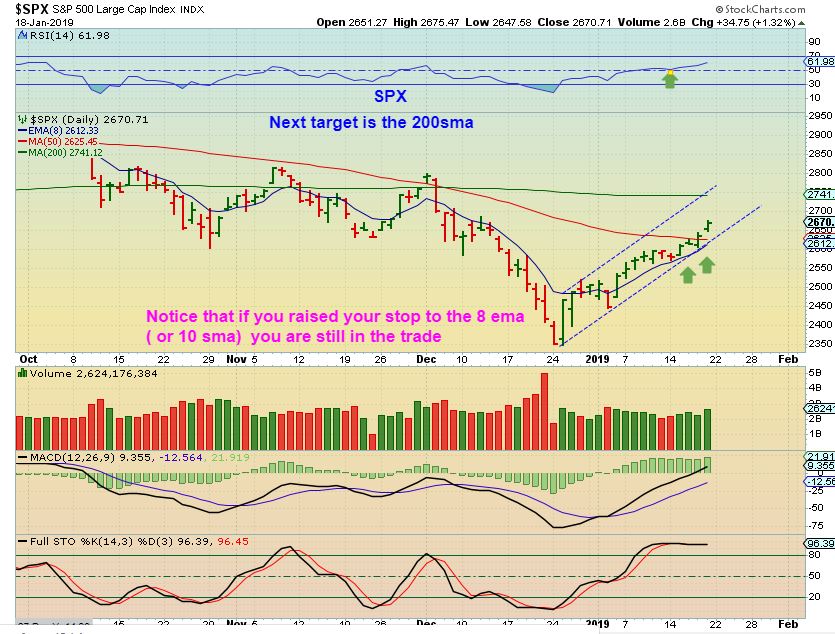
SPX – After about only 4 days sideways, The SPX , DJIA , NASDAQ , etc are slowly pushing above the 50sma. It does look like the SPX held the 8 ema, and wants higher price, so that may become the lower trend line. The 200 sma is the next likely target.
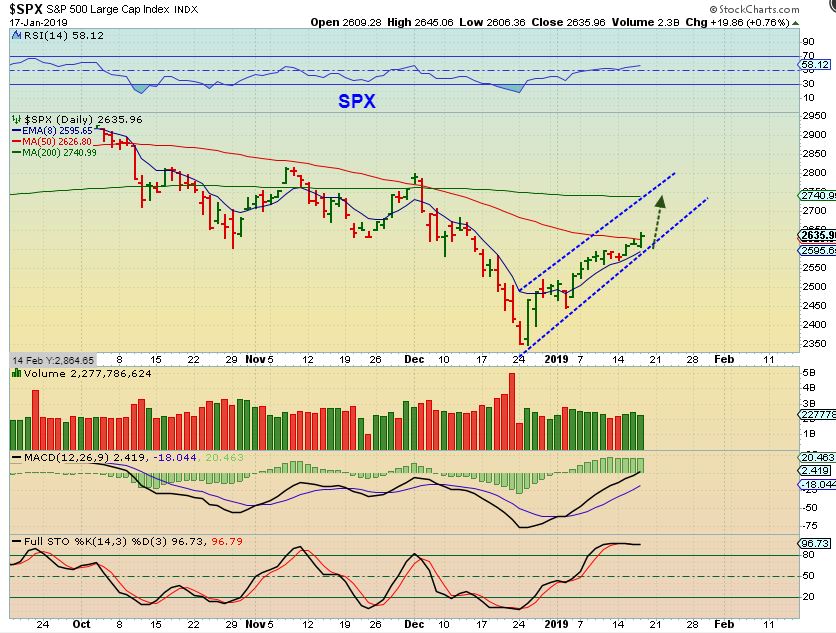
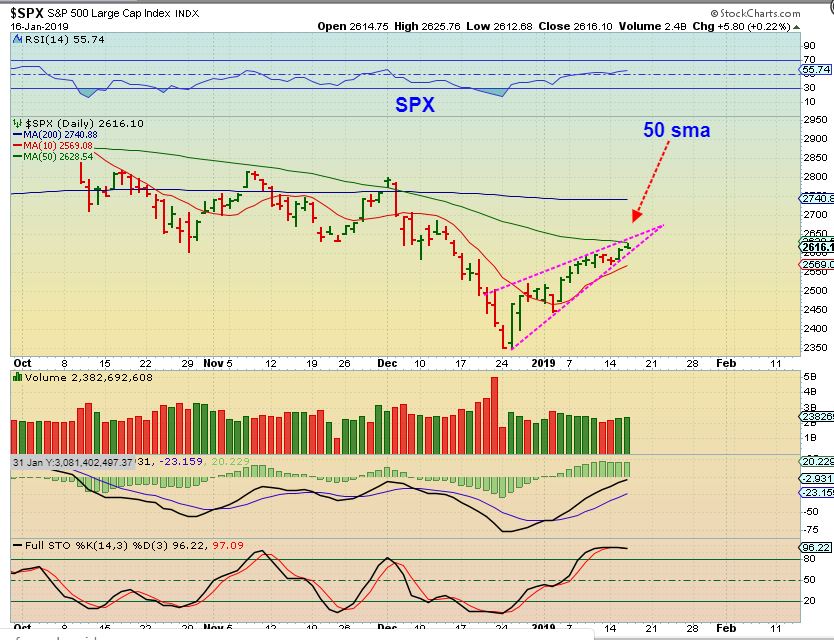
SPX Daily 1 - I also noted a rising wedge that might cause a pull back at the 50sma, but here we see here that on Friday it did break above the 50sma, and a run to the 200sma is possible ...
SPX Daily 2 - Since Friday saw the markets push higher, that wedge may become a channel higher. Read the chart.
 Read More
Today is Friday, the last trading day of the week. It is also "Options Expiration,' and that can affect pricing and volumes a bit, but so far things continue to play out pretty much as expected, so lets just get into our Friday report...
.
Read More
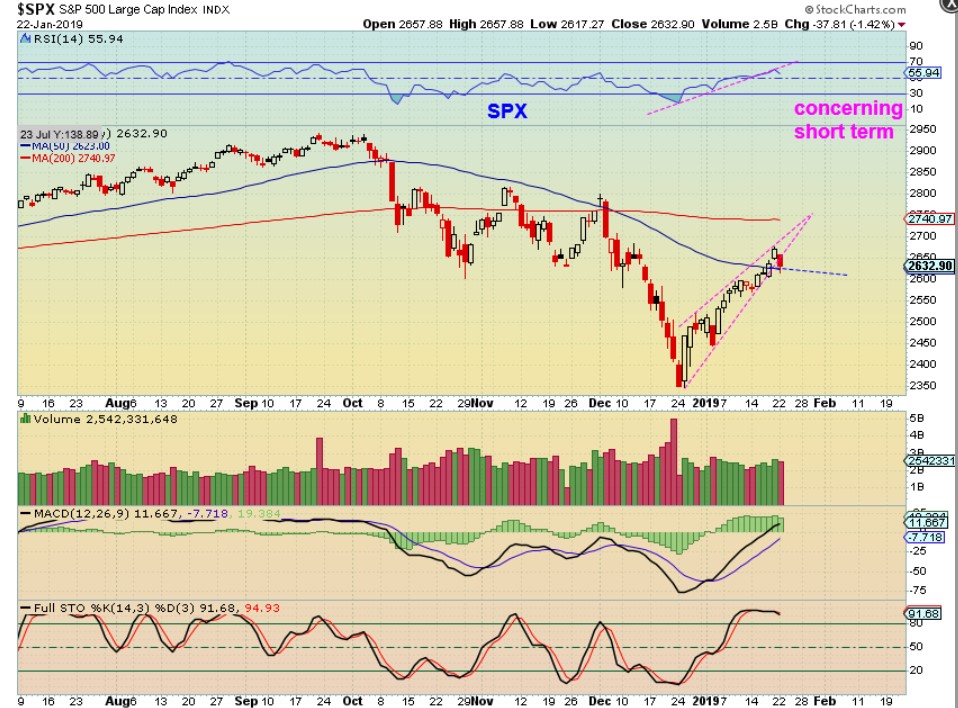
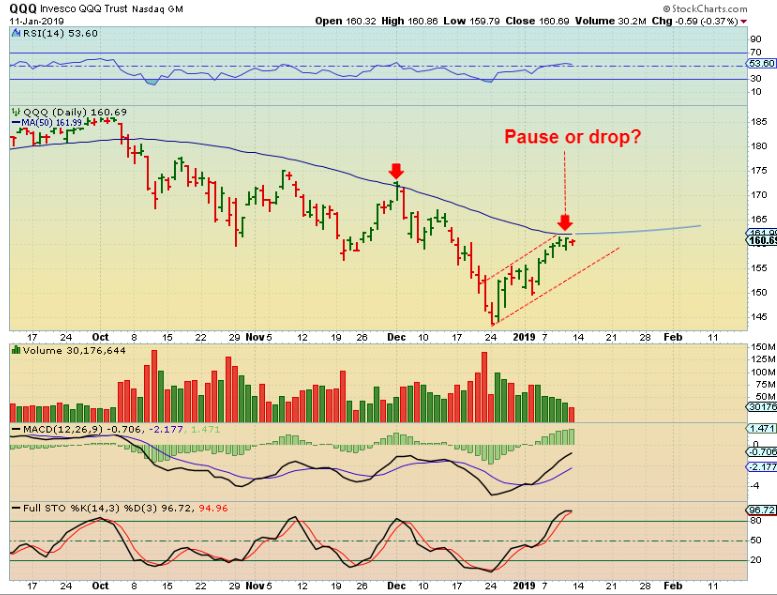
SPX - We still have a wedge that has formed. These usually break down, so with the SPX at the 50sma and a wedge, I would think that we may pull back for a few days.
That could be a 1/2 cycle low and it is not uncommon...
Read More
SPX 1 of 3 - After the pause that we expected under the 50sma, the equity markets actually look ready to break higher already, so
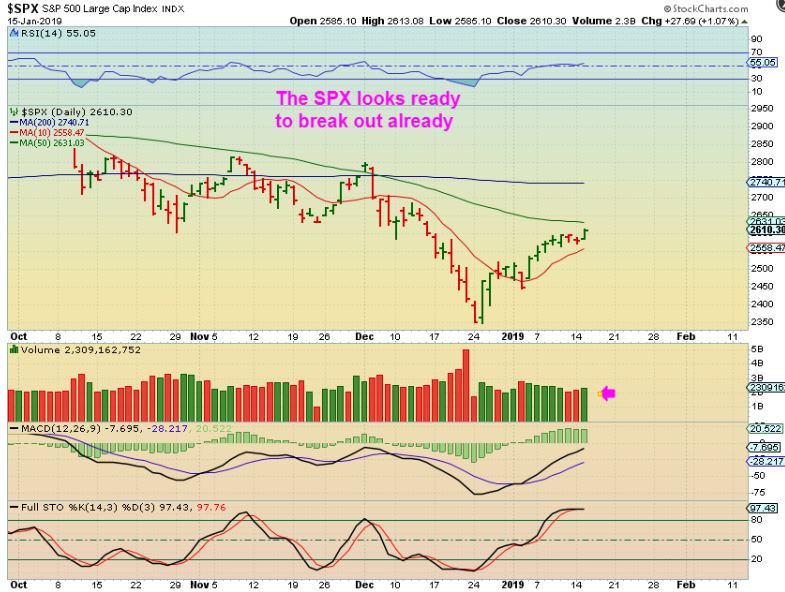
I want to show you these 2 charts ...
Read More Monday s market action did not change the expectations mentioned in the weekend Big Picture Review, but the trading has been very good and most of the recent buy opportunities continue to play out. Lets do a Tuesday review...
.
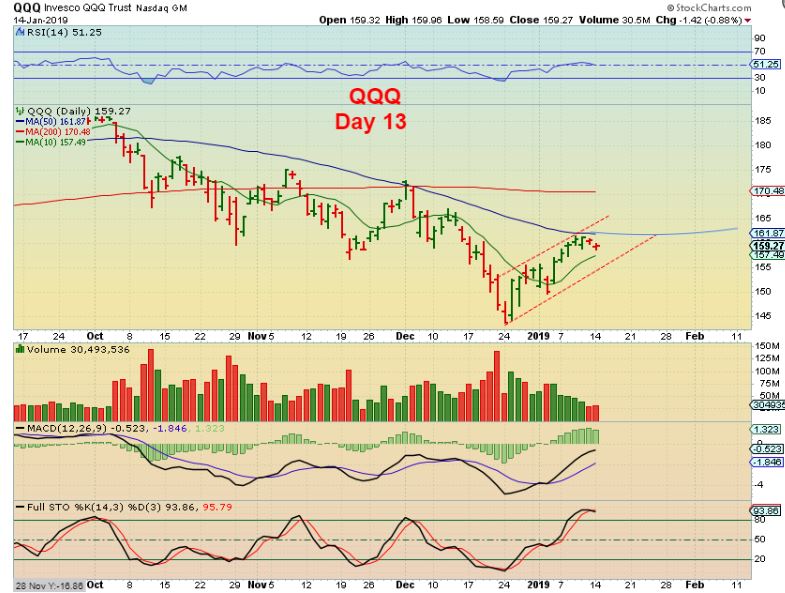
QQQ - We expected this pause and...
 Read More
This is the weekend report, where we can monitor the progress that the various sectors of the market have made, and what we may expect going forward. Since I give a more detailed day to day update in the daily reports, I often focus mainly on the Big Picture in the weekend reports by using the weekly or Monthly charts. This week , however, I will start with the daily charts in a couple of the sectors, to include a close up of where we are now, and then we'll get into our Big Picture Outlook.
.
QQQ Daily - We are pausing at the 50 sma, as expected. Will we go sideways or pull back? It really shouldn't matter, at day 12, I think that we should still break above the 50sma in the first daily cycle and maybe back test it on the dcl later...
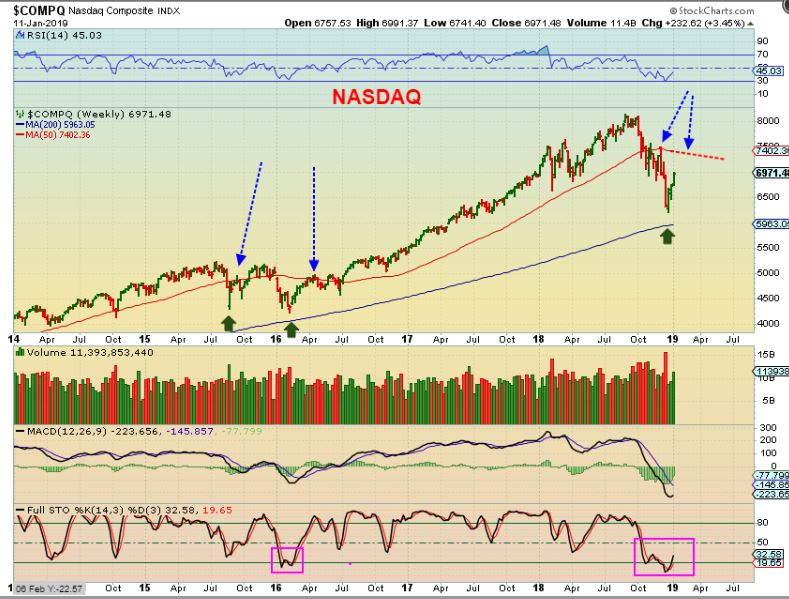
QQQ WEEKLY - This is an area that POSSIBLY may eventually become an important topping point. We are watching this s things unfold. If the FED stops raising rates in early 2019, I wouldn't rule out that the markets can hang in there a bit longer. FED PROPPED. I still lean toward a H&S top though, with highs in place.
 Read More
Today is Friday, the last day of trading for the week. It really has been a great couple of weeks of trading , so let's discuss a few things...
.
This was in yesterdays report...
.
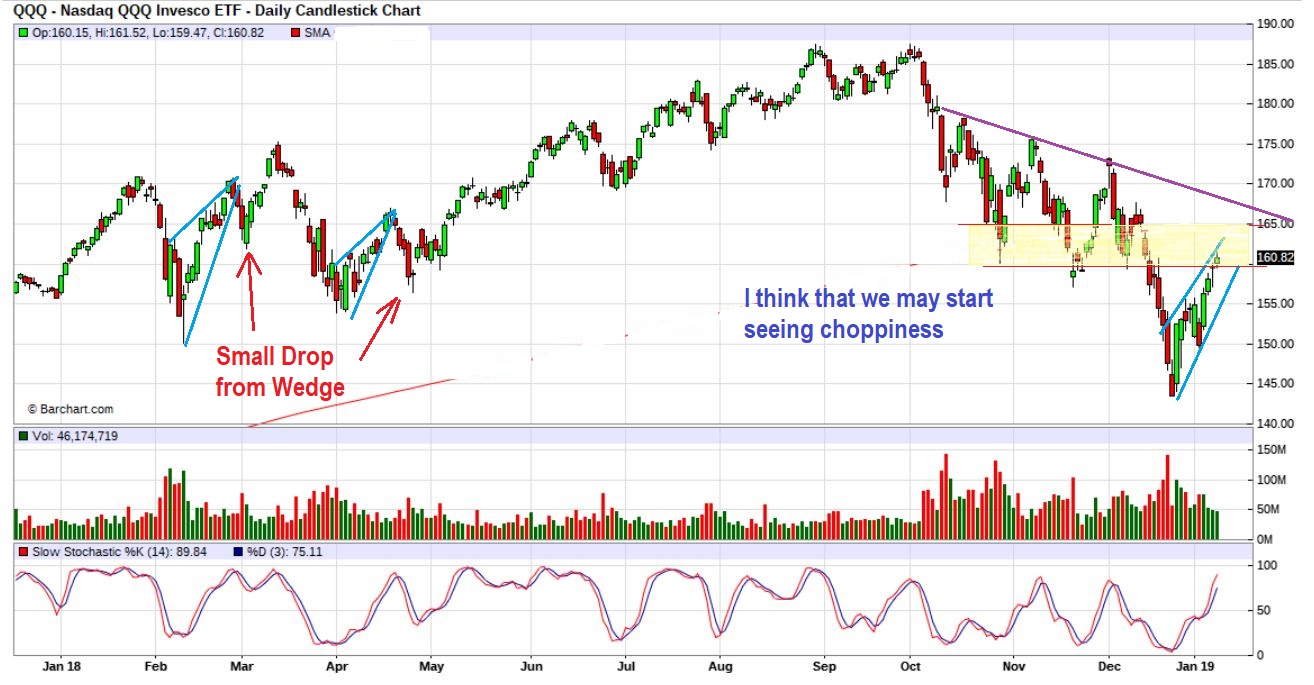
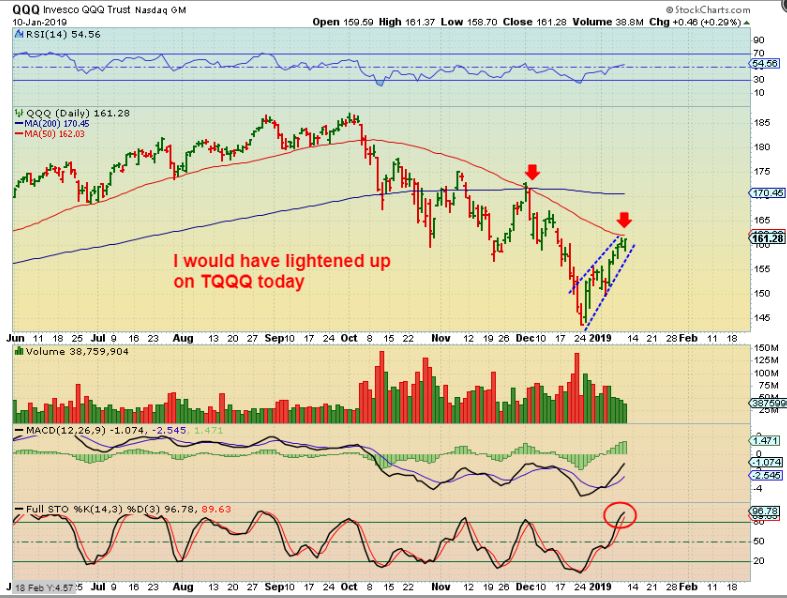
QQQ – I am also starting to see what look like rising wedges in The Nasdaq. This can push higher, but keep an eye on it. These can be short term bearish, and often break down, an example of this was seen last February and April.
QQQ - The QQQ tagged the 50ssma and the wedge remains in view. Read the chart.
Read More
Scroll to top