Some Winning Stocks You Might Have Missed
The overall market has been very choppy and that an be frustrating for a lot of traders. However, there were some real winning stocks this week. Did you catch them? Some of the highlights were $NBEV $TWTR $UBX
(Below is a sample of Alex’s work from throughout the week. )
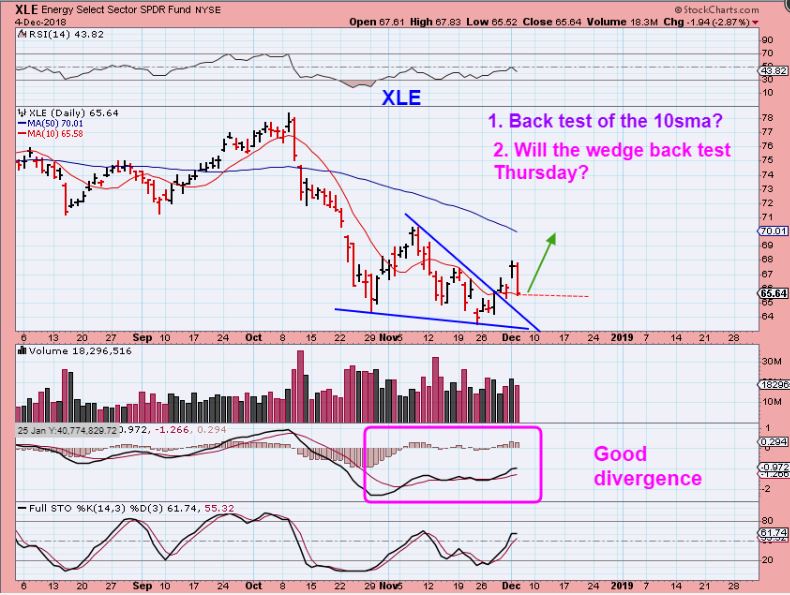
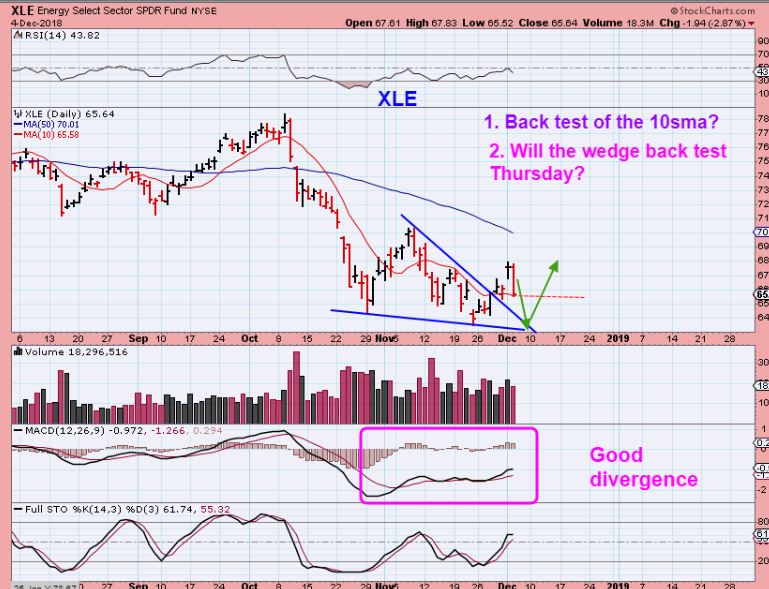
(Below chart from 12/11)
NBEV – WHAT A RUN IN SEPTEMBER! I bought NBEV instead of WTER and it moves fast. It is pushing on the 50sma, so lets take a look at WTER.
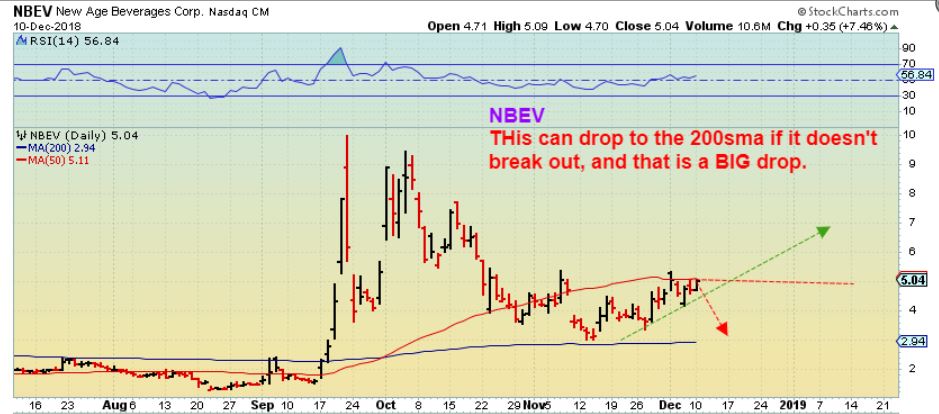
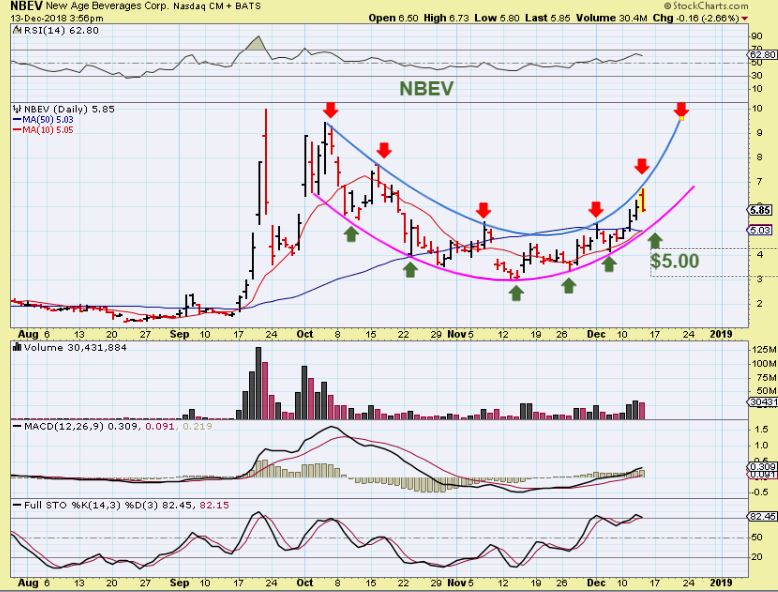
(Below chart from 12/14)
NBEV – NBEV Reversed Thursday, and I think that it could drop to the $5 area, if this is a back test of the 50sma.
(Below charts from 12/12)
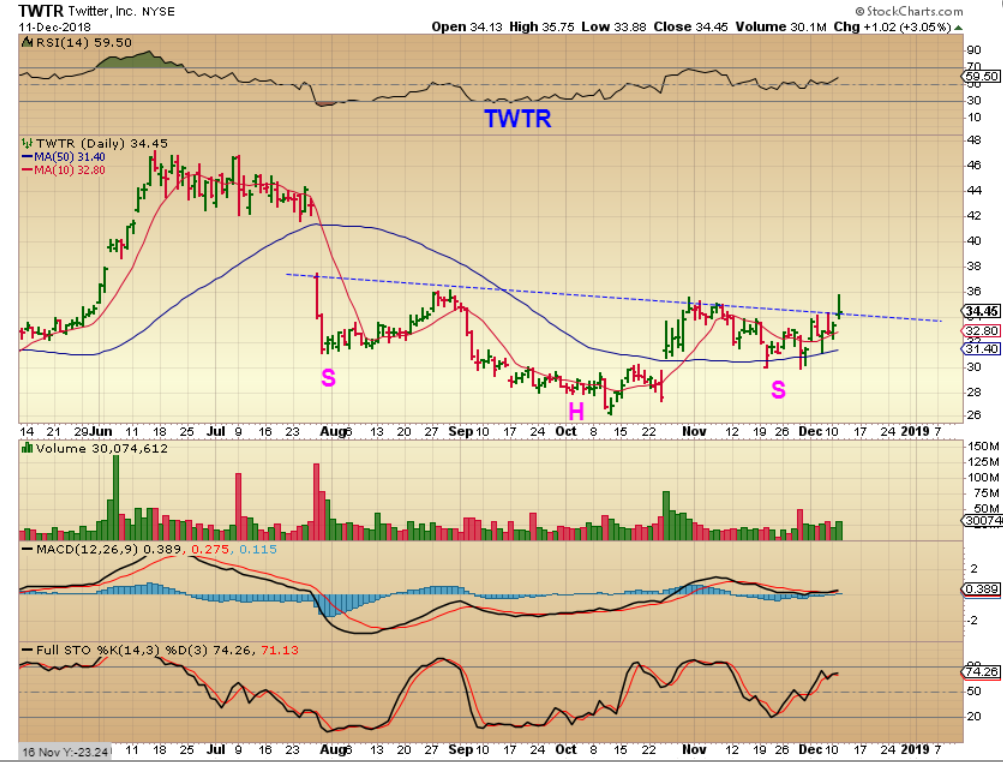
TWTR – The Stock Market (NASDAQ) is back at the October lows, but TWTR moved from $26 at the October lows to almost $36 in at October highs, and now it is still at $34 and looks ready to break out even higher. And…
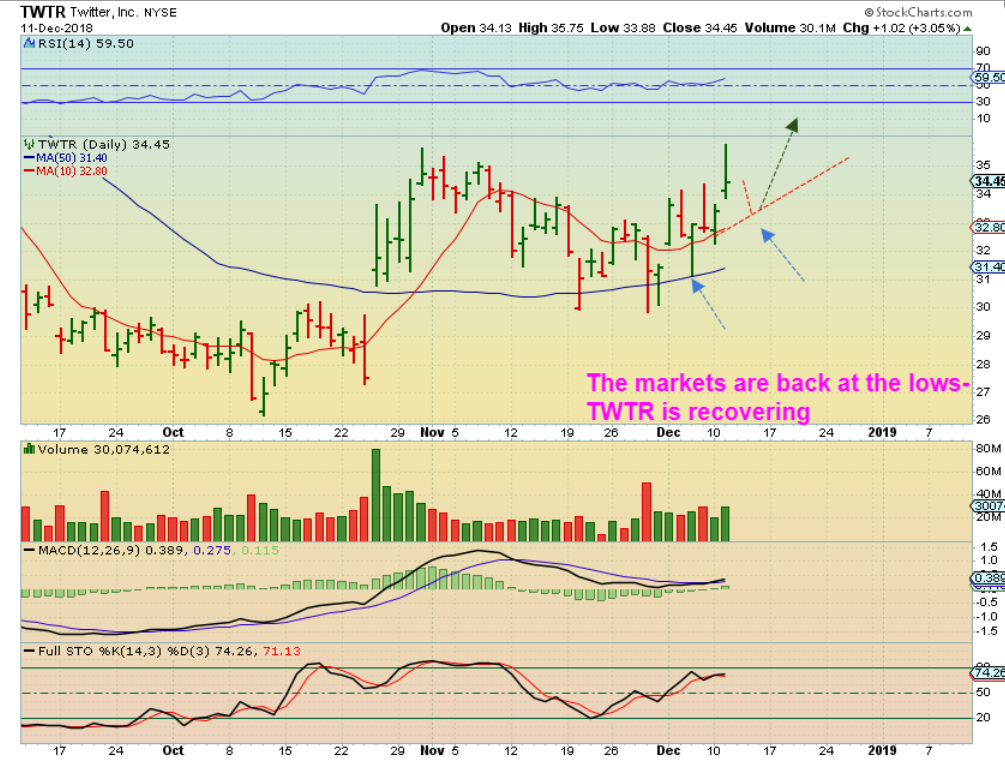
TWTR – I stepped back and saw
1. A large inverse H&S formed
2. With price now above the 50sma, and
3. The 50sma is already curling upward. This looks Bullish now.
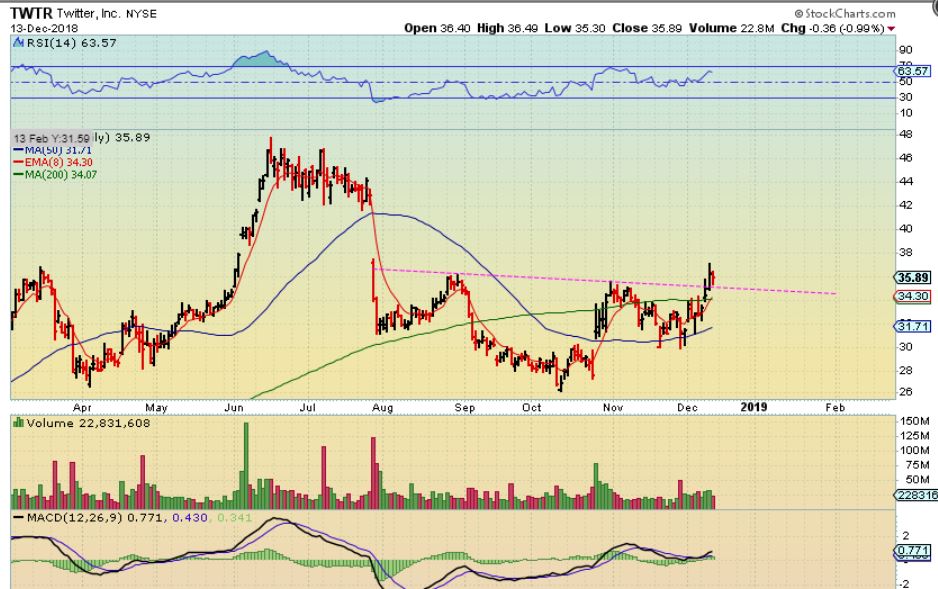
(Below chart from 12/14)
TWTR – This remains a bullish set up. I personally would not use too tight of a stop on a set up like this. A stop under the 200sma should keep you in the trade and not have to worry about the wiggles. This has rallied since the October lows and did NOT follow the markets back down to the lows, so it is a bullish set up.
(Below chart from 12/6)
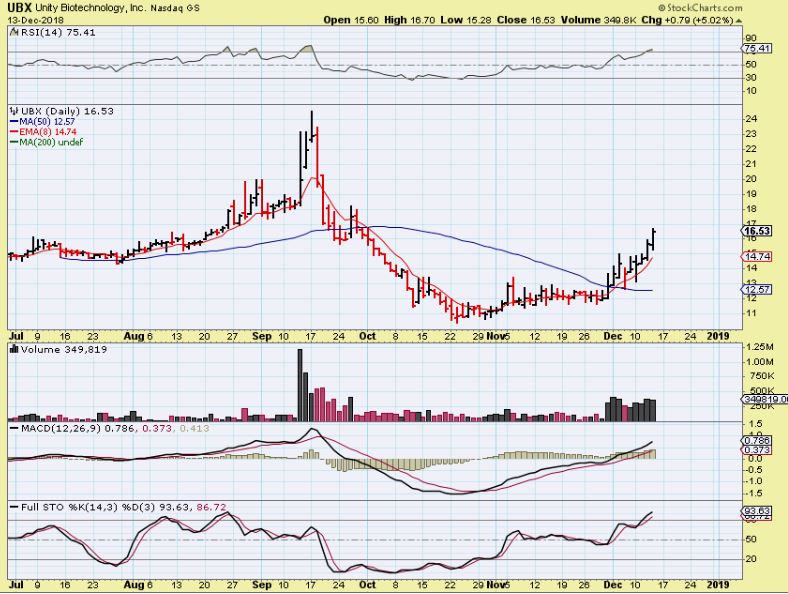
I said that I bought UBX near the 50sma, and it continued higher.
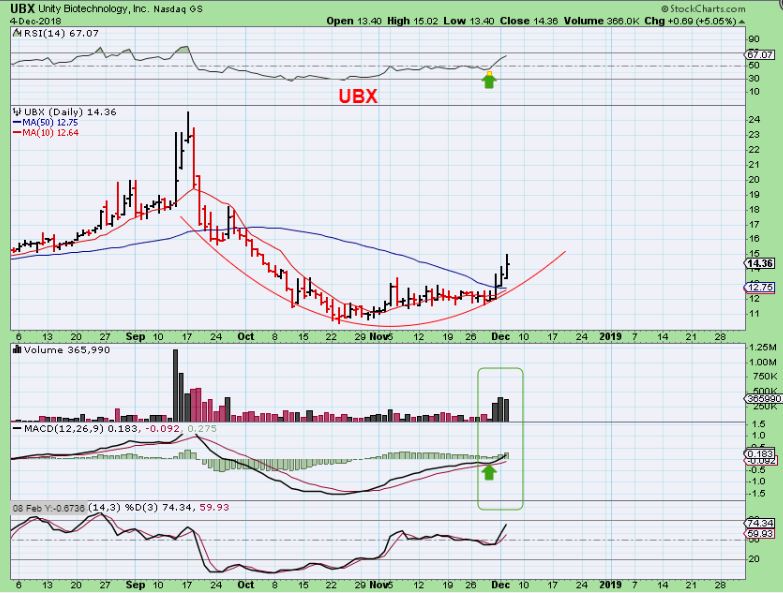
(Below chart from 12/14)
UBX – This stock just will not stop 🙂 $12 to almost $17 since last week. I liked this one for the volume coming out of that base too.
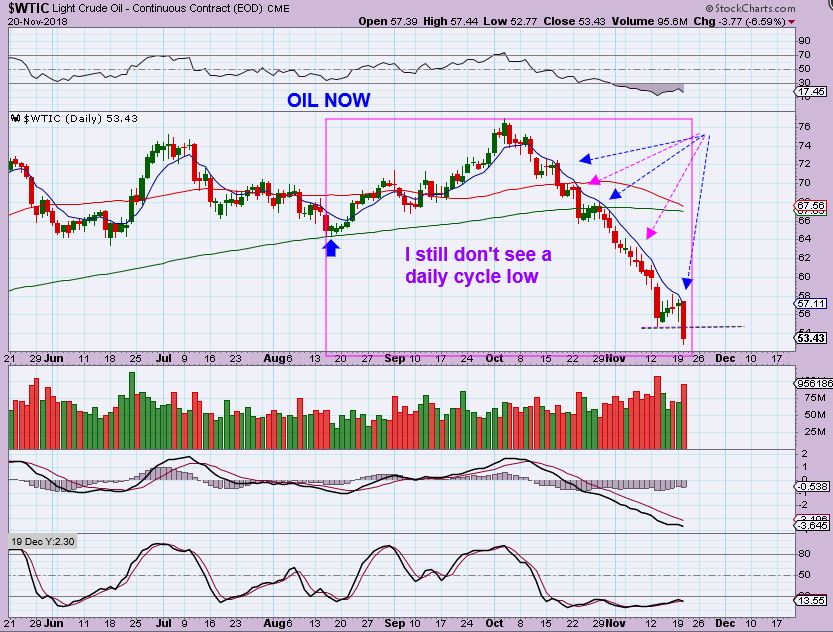
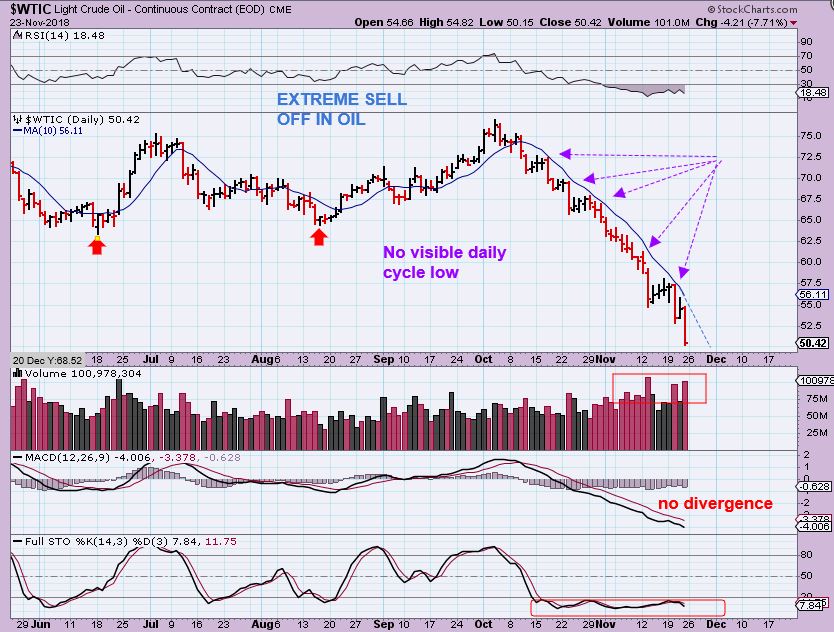
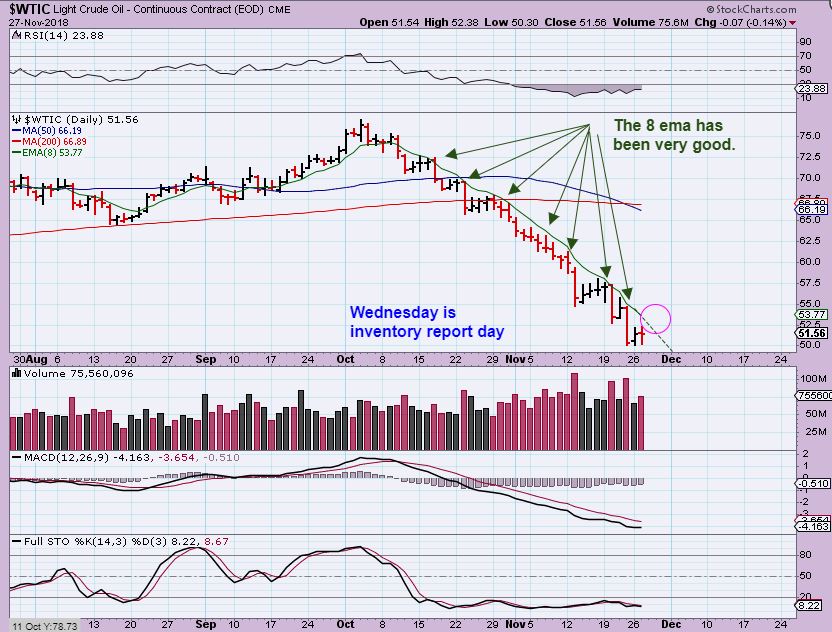
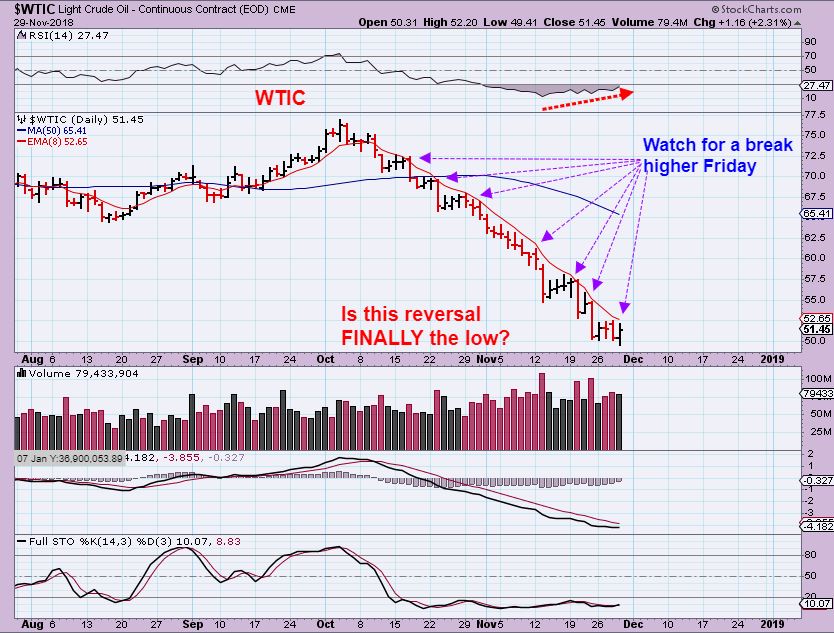
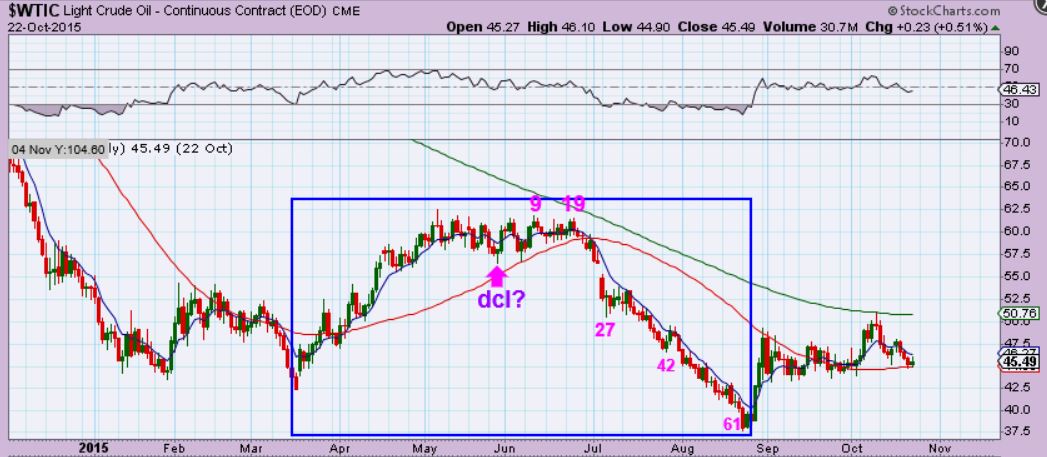
As a bonus: Keep an eye on Oil.
(Chart from 12/14)
WTIC – Oil seems to be basing after putting in a low 9 days ago, and the MACD is rising. This looks pretty promising.
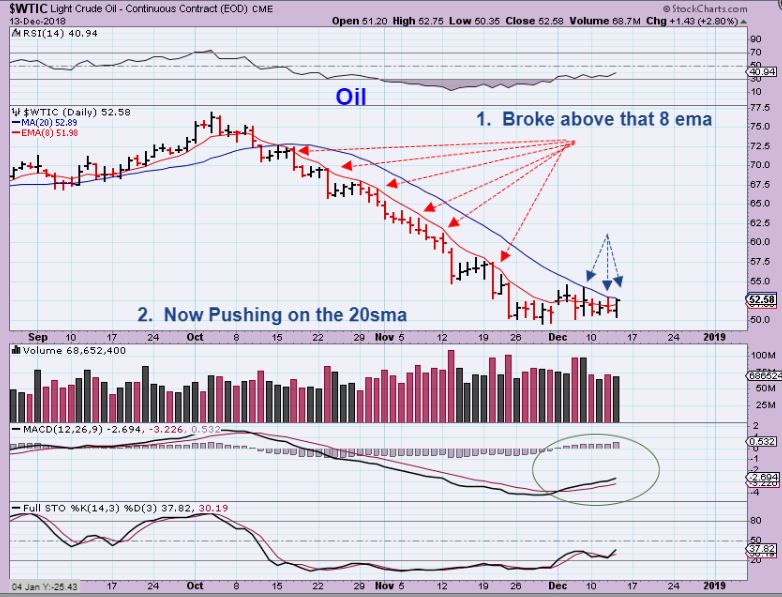
Chart Freak Membership
Alex has been successfully writing a daily newsletter service for nearly four years now and is considered one of the best traders of precious metals miners, energy/uranium stocks, and biotechs. This is your opportunity to join his service as a member and follow along as we enter the next bullish gold Cycle higher.
If you would like to find out more about the service or sign up, please click the buy option for more details.