
Top Notch Tops – Strategy Tips
(The images below are a sample of Alex work and are to provide a little education on understanding tops in a market or asset)
Like most things in technical analysis, spotting a top is as much art as it is science. When you see a top, it doesn’t mean it is time to run for the hills, take all your positions off the table, hyper leverage shorting the market or throwing computers out of windows. NOPE! It just means you need to be extra cautious with your trades, you probably should take some profits, de-risk most of your positions, tighten stops and don’t take on long positions on a large time frame.
Here are some clues that the market was likely to experience the sharp sell-off we experienced last week.
(From 10/13/18)
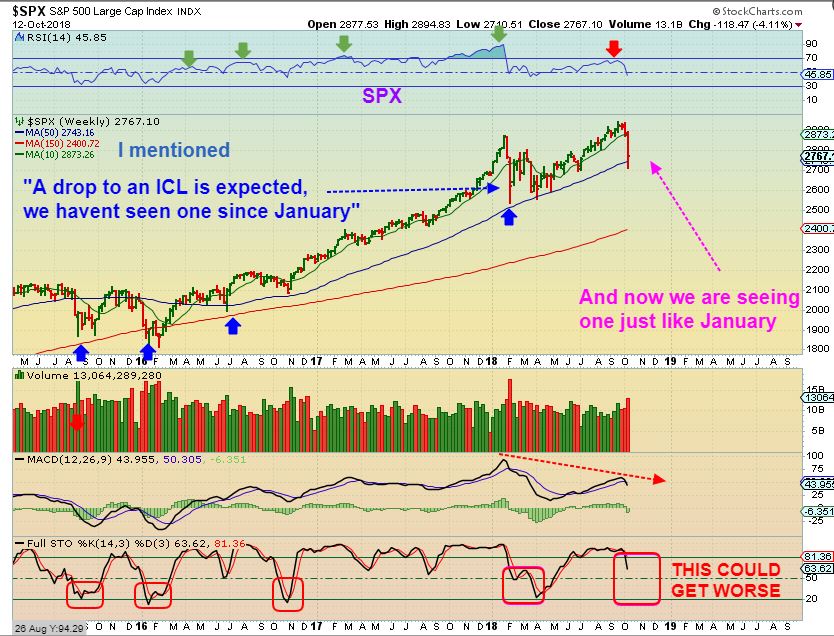
SPX WEEKLY – I’ve been looking for a drop into an ICL , similar to January. There it is, read the chart, and there is more..
DJIA WEEKLY – Look at the stochastics on that SPX & this DJIA chart. Each prior ICL bottomed with the Stochastic bottomed too. These are still Overbought on a weekly basis! We may bounce off of support, and roll over again. These markets need watching!
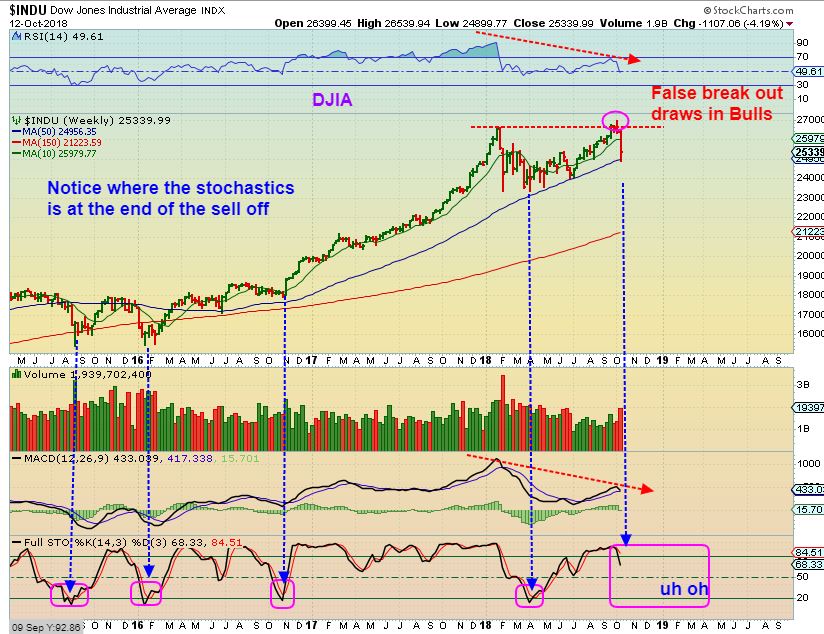
Indicators can be a traders best friend. They can also provide false signals, so don’t lean on them too heavily – use them in conjunction with price. ( TIP: Use them to provide further information to make your most informed decision, never make a trade based solely on an indicator) In the above examples on the Dow Jones and S&P, the MACD peaks were showing bearish divergence from the price which was rising. At the same time, the Stochastic Indicator was showing the market was overbought and trending down. Generally, when thinks are moving smoothly, the MACD and Stochastics tend to mirror the movements of price. When you have a divergence near the top, it is time to be cautious.
Remember, capital preservation should be higher priority than even making gains!
(From 10/16/18)
General Markets / SPX – We could bounce out of a daily cycle low, or this builds a bear flag and drops again. Timing is correct for a dcl. Notice also the price action after the February drop. A strong bounce to the 50sma and the price returned to the 200sma.
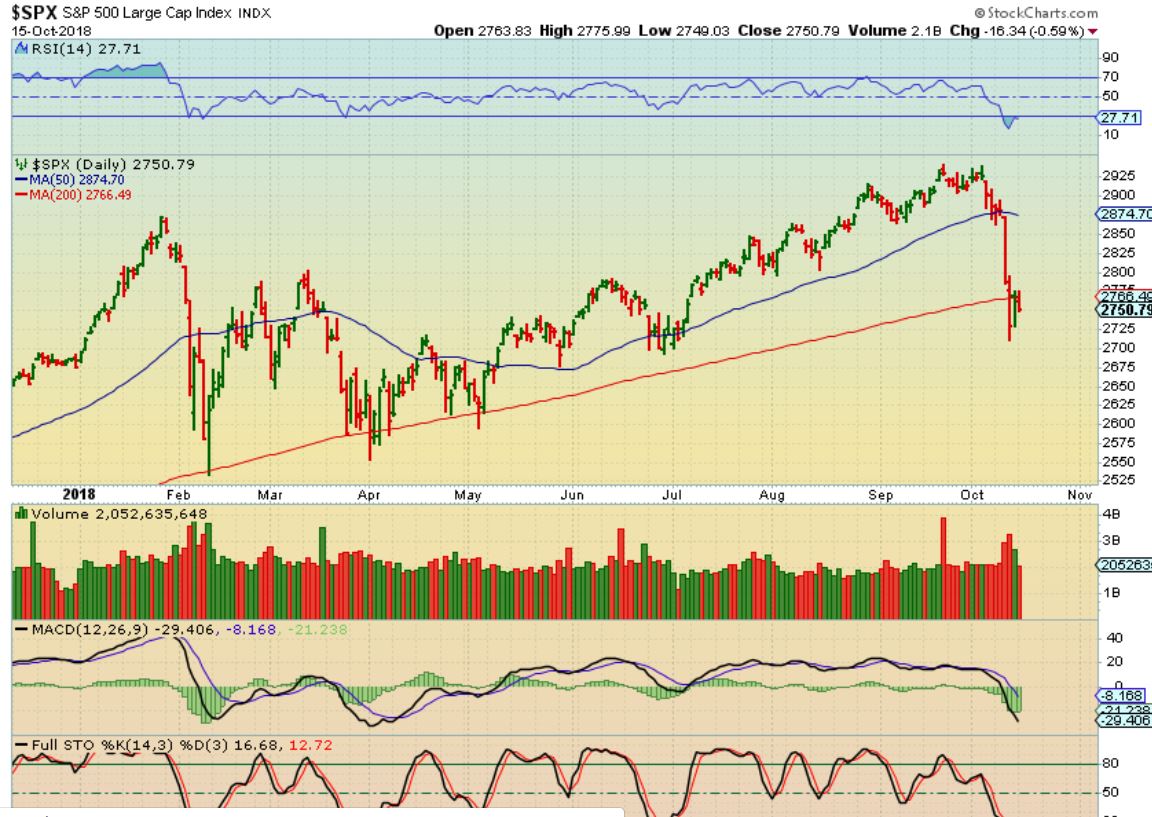
Did you get caught by surprise with the sell off? Don’t panic! Certainly don’t sell with the crowd. A couple days of patience, you could have recouped some of your paper losses on the bounce – OR if you are really saavy, add to your position on the dip and really gain some of it back by spotting a natural re-entry when it bounced off a major SMA (In this example, the Daily 200) Rarely do markets move in straight directions. They ebb and flow. Understanding that allows you to find the ideal entry and exit points.
(From 10/18/18)
MJ ETF– So the ETF is still technically fine, but I’m also seeing a double top with divergence, and that is a warnings that some of these may be overbought and the selling may continue (or further choppiness & consolidation). I lightened up on some of my holdings to lock in gains, and will see what happens going forward. Wednesday some were green, but most were red. See the chart
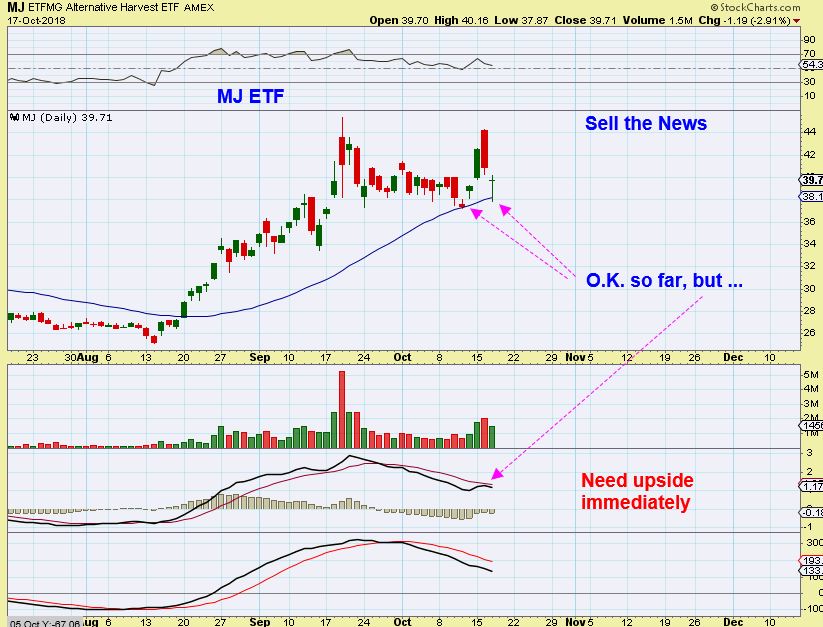
Another example of a possible top and divergence with MJ, the marijuana ETF. The day before and day of the legalization of pot in Canada saw some wild volatility that ultimately culminated in a sell off. Technically, it held together – in other words, a long position was still valid. Therefore, spotting a top could be a sign of a major trend change or it could be an opportunity for a great entry. It comes down to confirmation and just being responsible with your R/R and your stop losses.
There is so much more to unpack with tops (or bottoms) and understanding how to trade them to your advantage. I hope this helps shed some insight to your trading strategy. If you found it helpful, please consider subscribing and you will learn so much more!
Chart Freak Membership
Alex has been successfully writing a daily newsletter service for nearly four years now and is considered one of the best traders of precious metals miners, energy/uranium stocks, and biotechs. This is your opportunity to join his service as a member and follow along as we enter the next bullish gold Cycle higher.
If you would like to find out more about the service or sign up, please click the buy option for more details.