Archive for month: August, 2018
You are likely hearing the same thing that I am...
.
- "There is something incredibly wrong here, Miners have sold off before, but never like this!"
- "We have NEVER seen a drop like this in Miners, GDX will be in the single digits next week!"
- " This is much worse that 2008"
.
It is even possible that this kind of fear and panic can affect how you feel about what you see. Yes, the sell off in the Precious Metals is steep, and it is the talk of the town. This week the drop in Miners has been extreme, as you will see, but is it really the worst drop ever? Does it automatically make Miners destined for the grave? I want to address this in light of these statements above first, and then I will still cover the General Markets, so let's begin...
GDX - GDX closed down 2.37%, and the last couple of days have been crash mode, no doubt about it. I mentioned in yesterdays report that the volume looks like capitulation. This is a very sharp drop, however...
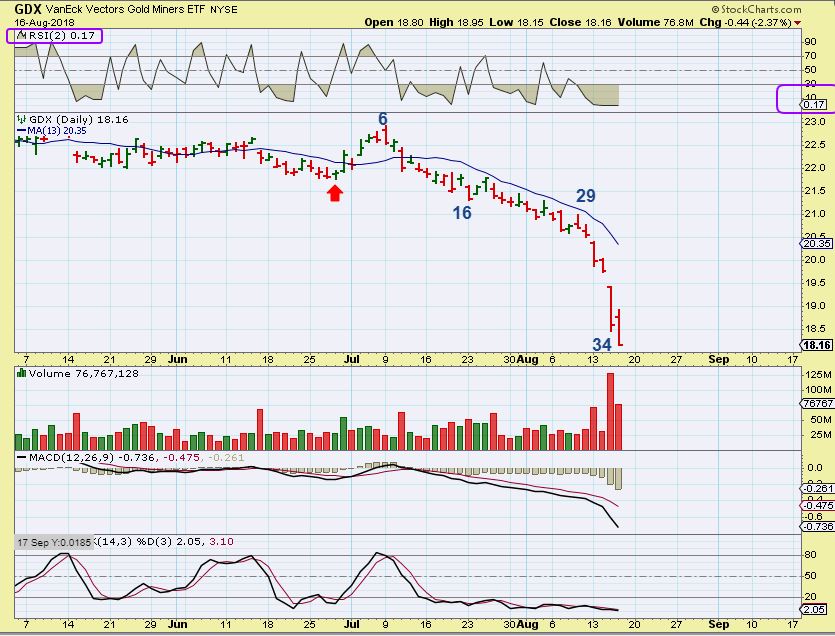
Now let me show you something that you may find interesting. It might even blow your mind ...
Read More
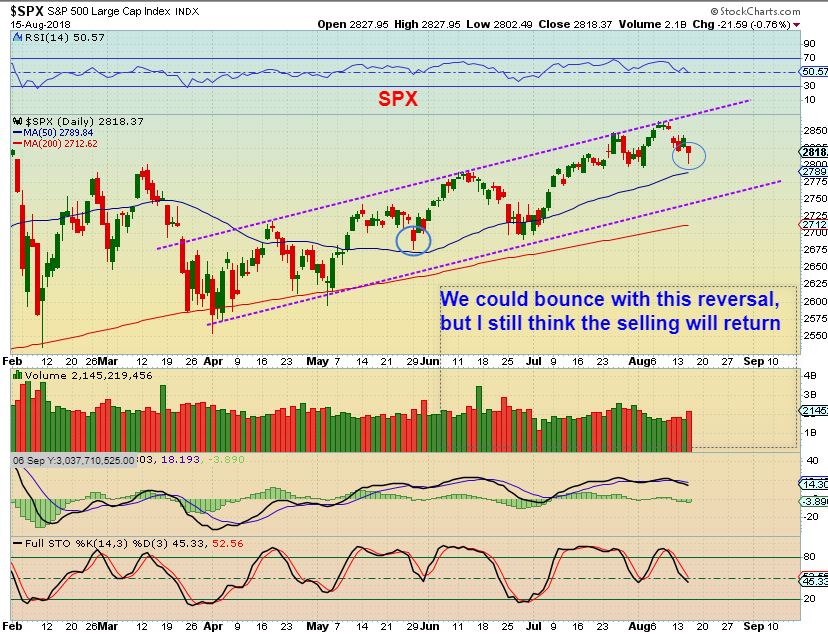
SPX - We saw the markets drop on Wednesday and start to recover as the day ended. I am expecting a dcl, and I do not think that this was it. We could bounce & drop or just continue lower, in my opinion.
 Read More
The markets still look a bit mixed, and I am expecting a dip into a dcl, so let's start by taking a look at the current set ups.
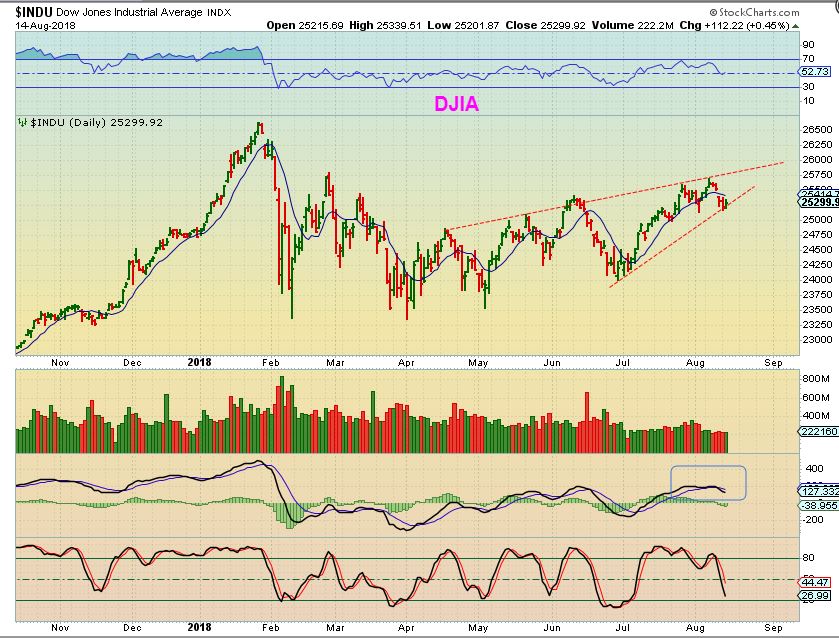
DJIA - I am expecting a dip into a daily cycle low and the DJIA appears to have a bearish rising wedge forming. There is room in the apex for another pop, but it should break down from here, since we are due for a dcl. Again, the DJIA is only 1/2 way to the Jan highs. After a decent run out of the last DCL, it has been a bit choppy.
It looks like we are back to Mixed Markets, some sectors stronger than others, but since I am expecting a drop into a DCL, I would be fairly cautious in all areas short term.
Read More Can't you hear the Thunder? There are plenty of rumblings out there in the land of the Miners. They have finally decided to really Join Golds sell off in earnest. We'll discuss that in the precious metals section after a quick market update.
.
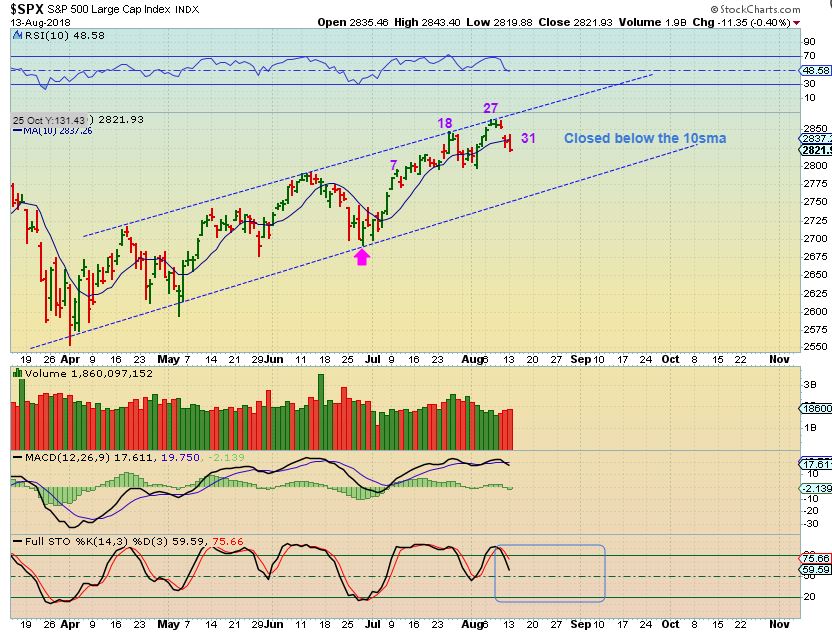
SPX - I've been expecting a drop in the general markets, and on day 31, closing below the 10sma, this is likely a drop into a dcl starting.
 Read More
PART 1
.
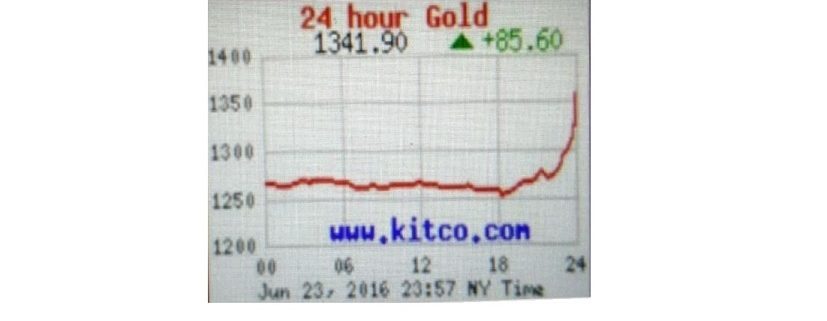
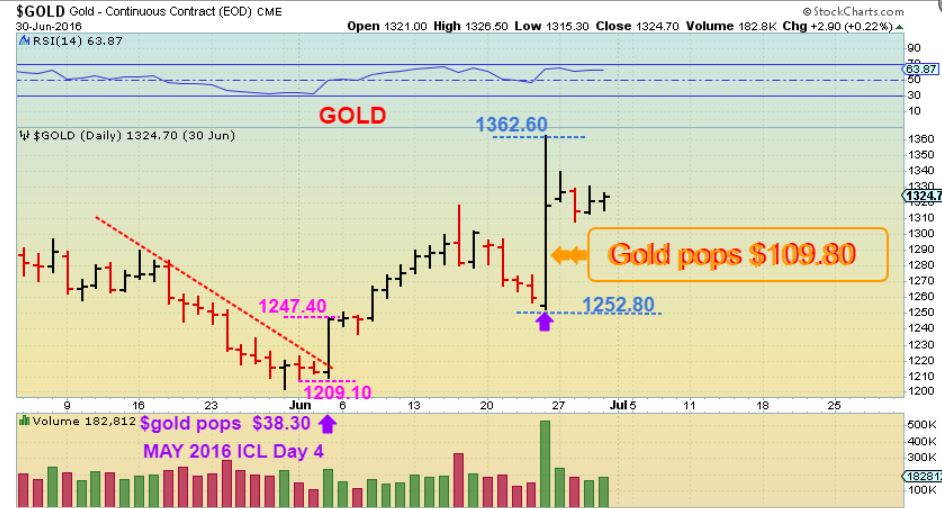
Yes, that Theme Picture is a real un-doctored Gold Chart that I captured 'live' one night at midnight as I was writing my report. In this report I wanted to show you some things that You may find quite interesting about that time period...
.
You may not even remember June 3, 2016 or June 23, 2016, when they actually should be very hard to forget. I want to tell you the story, so that you at least you know what possibilities do exist 🙂 I write my reports later at night, and Gold was slowly rising from $1250 one night when I started writing it. Well, it started ramping up and just kept going, rising up almost $90 to $1241.90, as captured by me in the Theme pic live late that night. It did NOT stop there. It actually jumped $109 points that day. Let me tell you a story ...
.
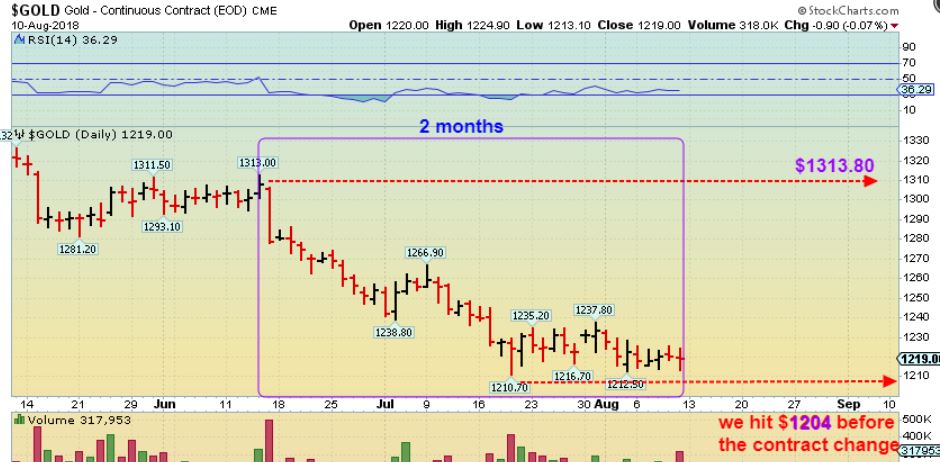
In May 2016, Gold sold off into an ICL. Interestingly, it dropped from $1310 to $1200, and you could say that from May 17th to the end of May it was all red, red, red, day after day. THAT KIND OF SELLING GETS TIRING 🙂 I say that because we just sold off from $1314 to $1204 too, almost the exact same amount (but we took 2 months to do so, VERY TIRING). Back to 2016, we had our ICL in place at the end of May, but it just went sideways for 2 days. On day 3, or 4 days after the lows were in place, Gold went Boom! It took off, rising up almost $40 in 1 day, and kept on going for 2 weeks. After a brief pull back, BOOOOOOOM! That Pop of $110 followed.
.
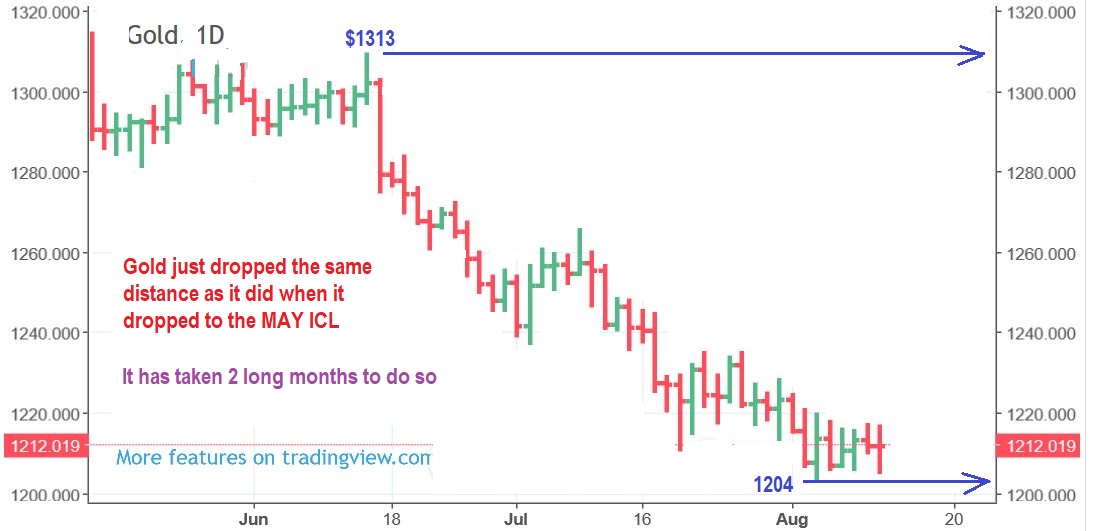
THIS IS GOLD NOW, and we also just sold off from $1313 to $1204, it has just taken longer. When the contract changed to December, this chart was altered a bit, so I will show the Spot Gold chart too, for accuracy. It shows the NEW low that Gold traded at when it hit $1204.
SPOT PRICE - 2016 took 1 month from 1300-1200, but this has taken 1.5 months
We will cover the General Markets, Oil, The USD, etc. next, but then I will have PART 2 of this discussion at the conclusion of this report. At that time, we'll discuss the current set up in the Precious Metals sector. It is an important conclusion to this very interesting story. Enjoy 🙂
Read MoreThat theme picture seemed funny, because it seems like day after day the deterioration has been relentless in that sector. Actually, many Miners do not really look that bad, and I will point out a couple of Miners that are setting up rather nicely too. We'll be discussing the General Markets , Oil, The USD , and Precious Metals for the final trading day of the week.
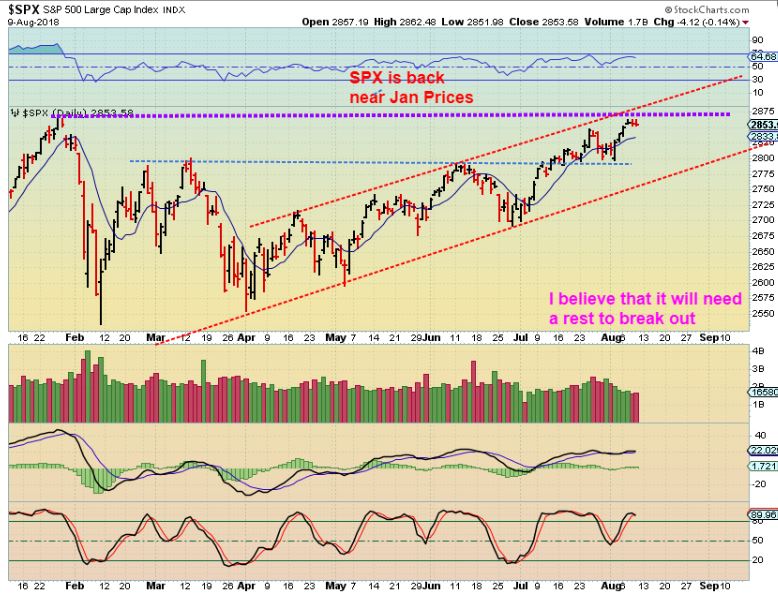
SPX - So the SPX is near the highs of January and we have resistance up here. We are coming due for a drop into a DCL, but this became a right translated daily cycle, so we can expect a drop and then a return to these levels. The channel has been a good guide for DCLs so far.
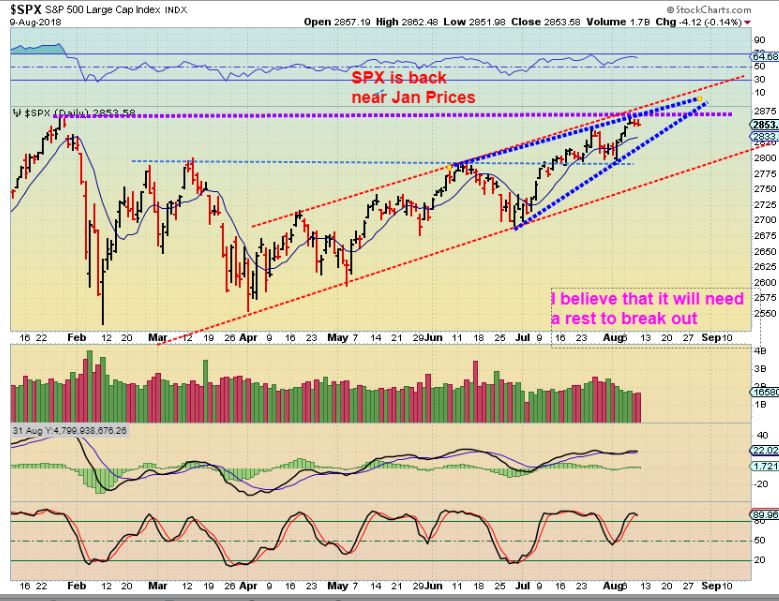
SPX - Stepping back, we see a bearish rising wedge. The Apex is actually about a week or two away, so this could go higher, but with the purple & blue line as resistance, it may get rather choppy and then drop.
 Read More
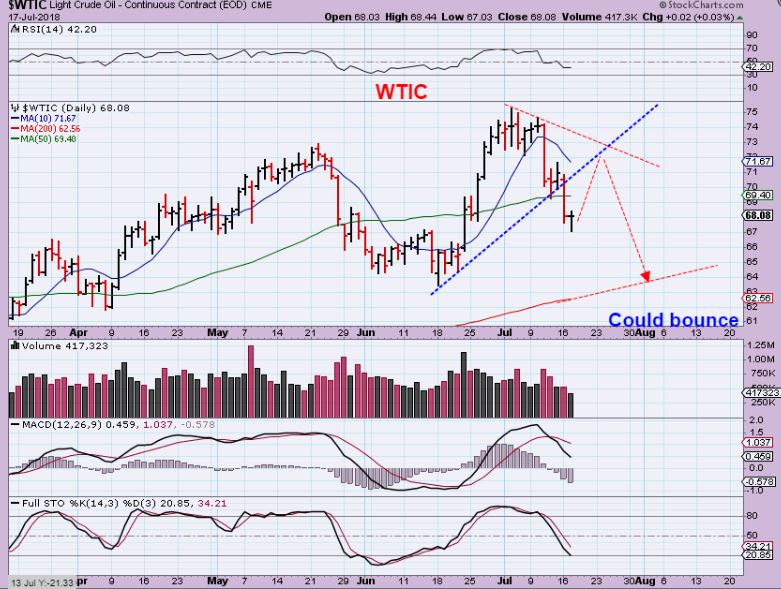
WTIC - Almost 1 month ago I pointed out that I was expecting a Bounce from here, but that it would stall and drop as drawn (possibly to the 200sma).
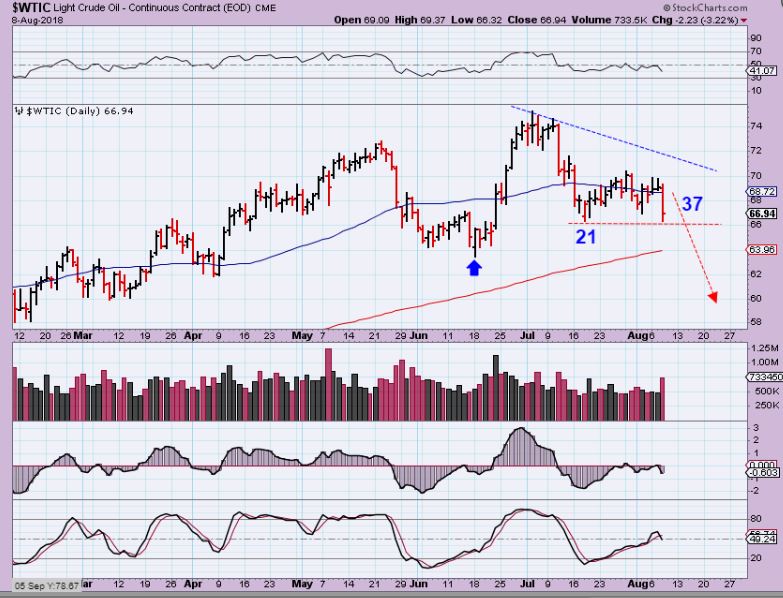
WTIC - Oil bounced & dropped as expected. I now expect this drop to take out the lows of the DCL ( The blue arrow) and form a failed daily cycle, eventually seeking out an ICL. I wouldn't be surprised now if Oil breaks below the 200sma in a shake out too.
THAT SAID, For those that are interested...
Read More That was what we wanted to see in Miners, so we'll discuss that in detail shortly, right now let's start with a market review...
Read More
SPX - The SPX actually made a new daily cycle high on Monday. That is a peak on day 26 so far, and that leans toward being R.T. , but this also looks like it wants to continue higher. Prior highs and the upper trend line is a bit higher than current price. SPX looks like it wants to run to the circle.
 Read More
 In the weekend reports, we take a step back and try to look at the big picture. It looks like we are VERY CLOSE to some changes. Let's take a look...
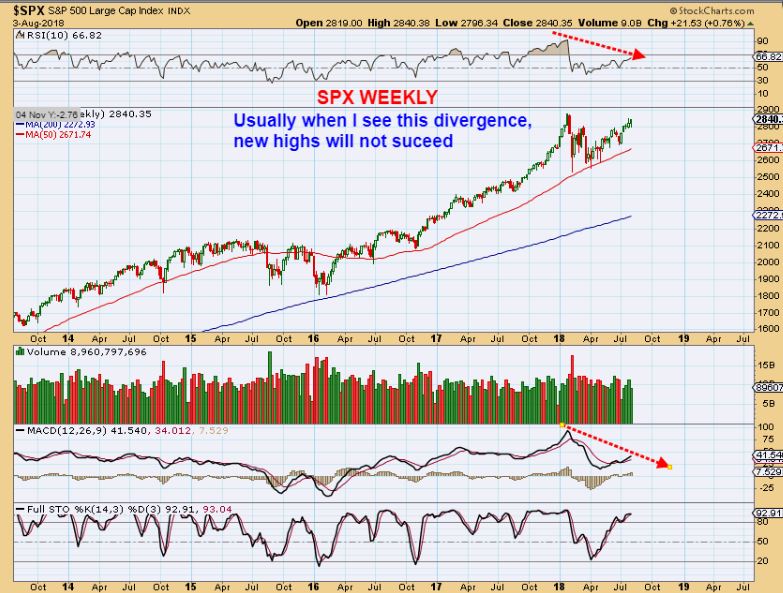
SPX WEEKLY #1 - I have been discussing this divergence. It is not a sign of strength at the highs, though the big picture is obviously a bull run. Bull runs can & do pause and falter as the consolidate recent gains, see 2015 into 2016. This can take months. Read the chart.
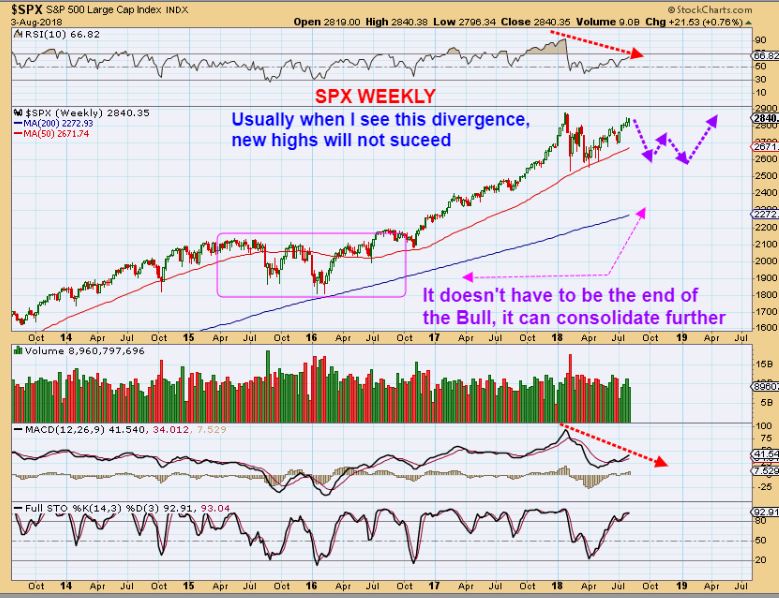
SPX WEEKLY #2 - Again, Bull runs can go choppy and difficult for weeks, months, even years, as seen here. Read the chart.
 Read More
Scroll to top