
The Mesmerizing Bitcoin/ Blockchain Trades
I have decided to release the Premium Dec 28th Premium Report & a bonus Bitcoin report at the end, to the public. Enjoy!
This is the regular market report, with an extended section on Bitcoin / Cryptocurrency at the end. The Bitcoin section will be released to the public later today too. For now, let”s review some of the areas of interest in Wednesdays markets.
SPX – No change in expectations from yesterday.
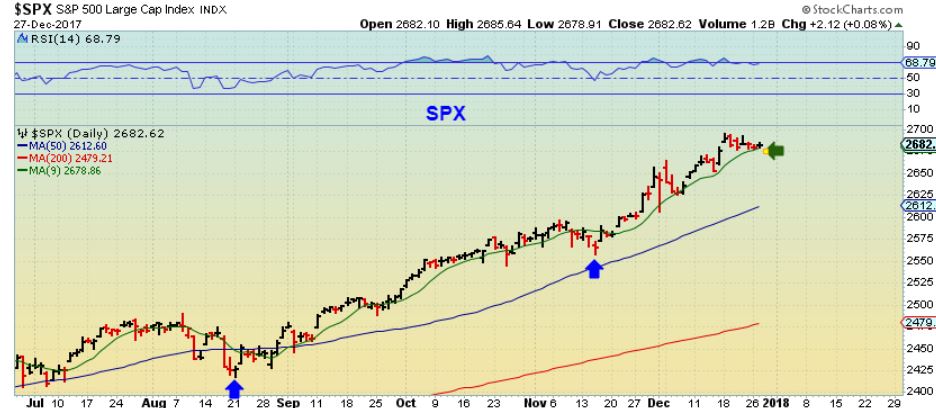
You want to keep this in mind though…
That SPX is due for a dcl and a drop below the 10sma will be a warning shot. In my mind, I actually think that we could sell off for a bit in Jan of 2018, when people can sell their gains made during the the 2017 year, and not have to pay taxes on them until 2019. Please keep that possibility in mind.
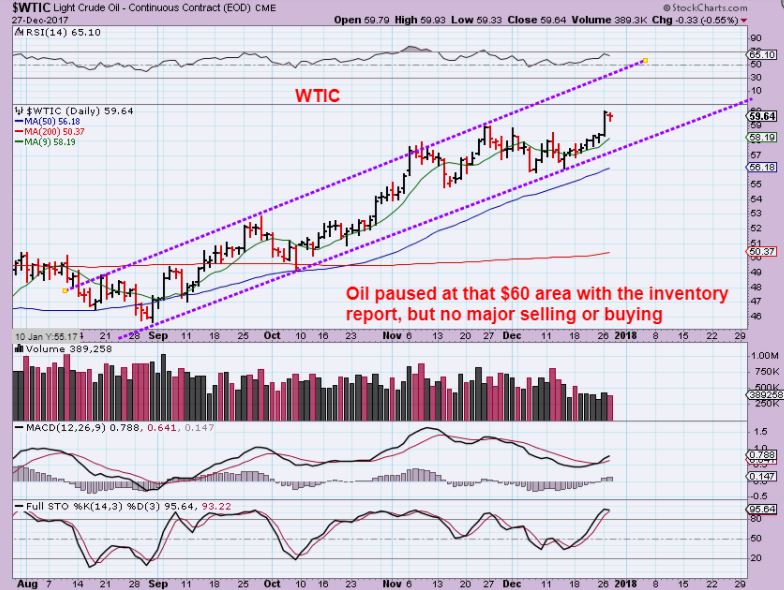
WTIC – The inventory report came out and Oil did stall at that $60 area. It still looks bullish, but the COT has me cautious. I am not long or short this sector currently.
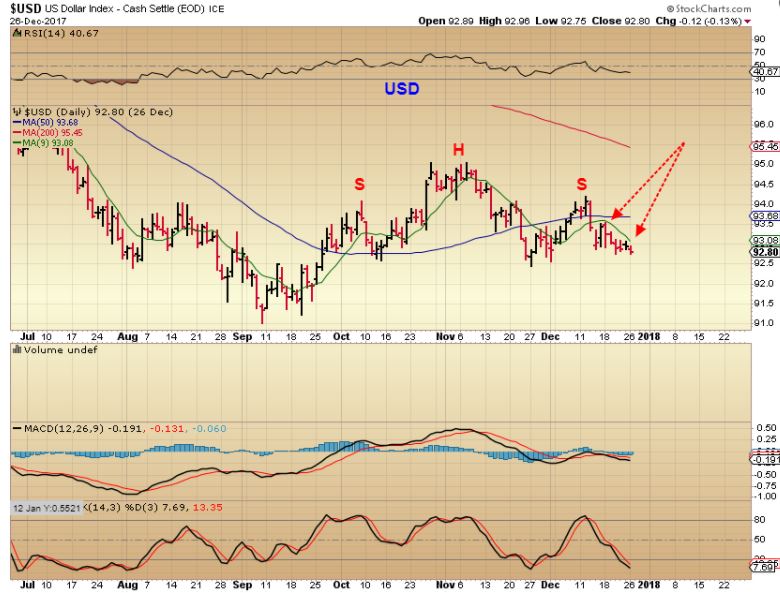
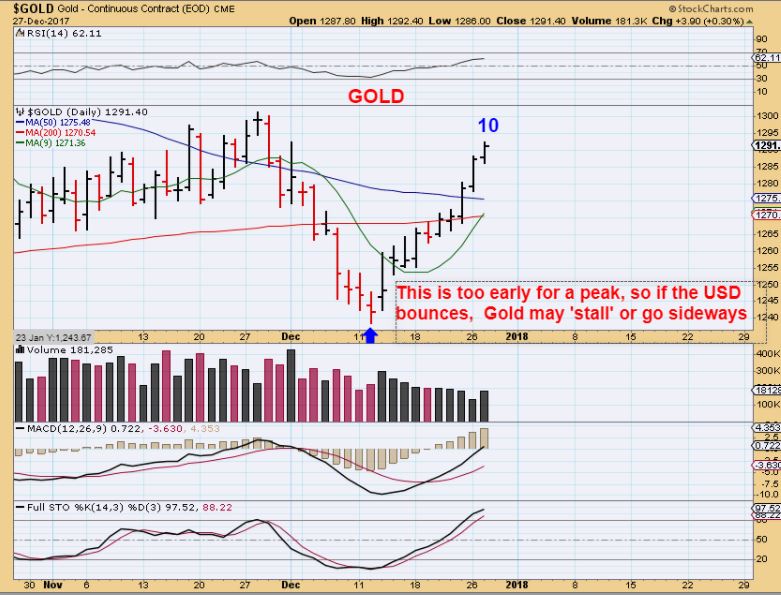
USD – The dollar is coming due for a dcl, and when it bounces out of one, Gold would usually drop into a dcl. Maybe this H&S plays out first, pushing Gold a bit higher? The problem is that Gold is only on day 10 of its daily cycle and that’s just too early for a ‘peak’ rising out of an ICL. First daily cycles out of an ICL are usually around a month long, so Gold may just stall or go sideways if the USD bounces. Lets look at Gold…
GOLD – If the USD bounces out of a dcl, I think that Gold will resist any major looking selling. It may pause or go sideways. I will give ideas when we look at GDX / GDXJ. Please read the chart.
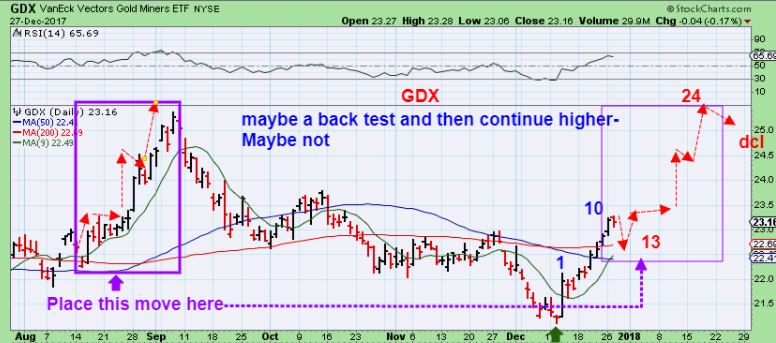
GDX #1 – So far we caught this entire move out of the lows. THIS IS JUST A GUESS, AN ESTIMATE, 3 IDEAs OF HOW THIS CAN PLAY OUT. Since Day 10 is too early to peak out of an ICL, I’d picture a dip and another run like this, all in 1 daily cycle or…
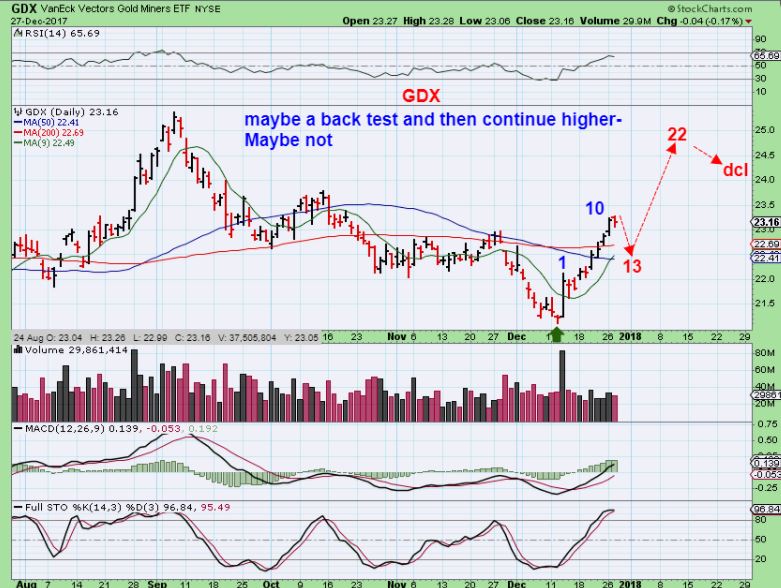
GDX #2 – A day 24 Peak ( Give or take a couple days) with a 1/2 cycle low now?
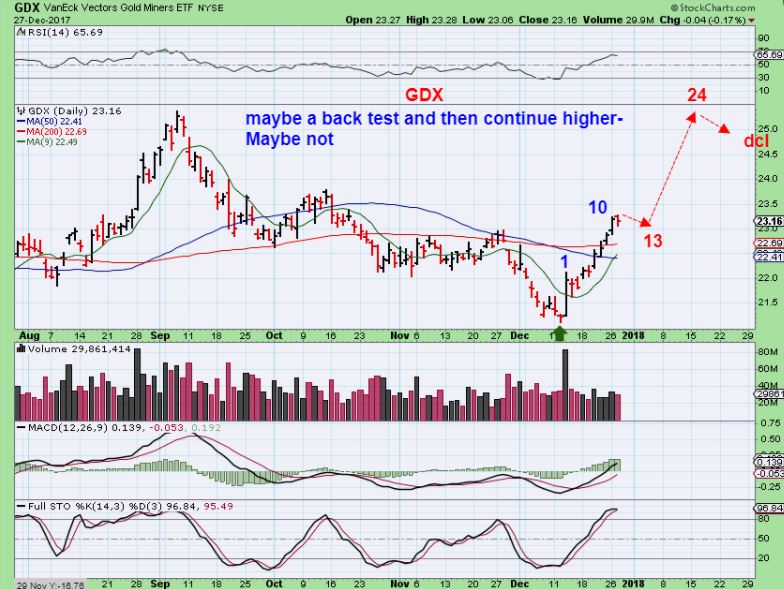
GDX #3 – Or copy the last run in August into the highs ( purple box) to finish ‘the current cup’.
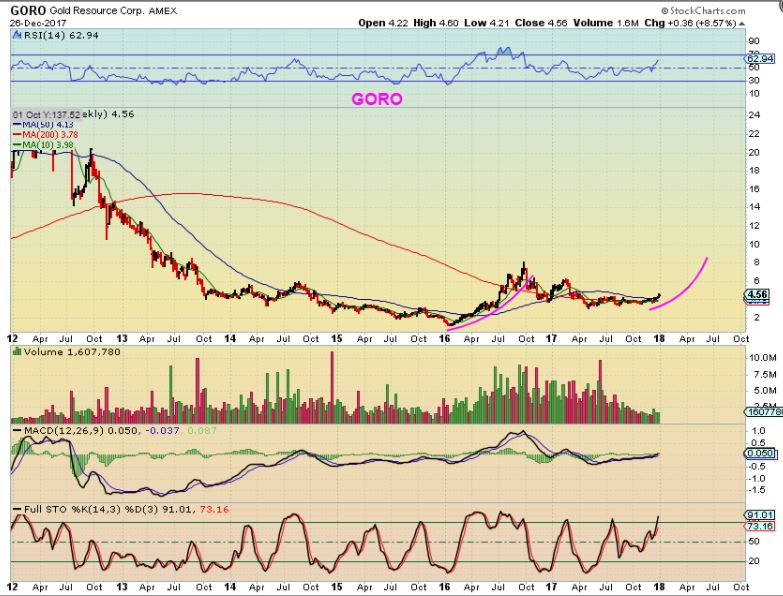
GORO – With Goros recent run, is it time to sell? I’ve been asked that for GORO, AUY, MUX, etc. Please read the chart. I know that some have been burned in the past holding on too long, but Miners are only on day 10. This has not been ‘too long’. Could it pull back a bit? Yes, there is always risk, however…
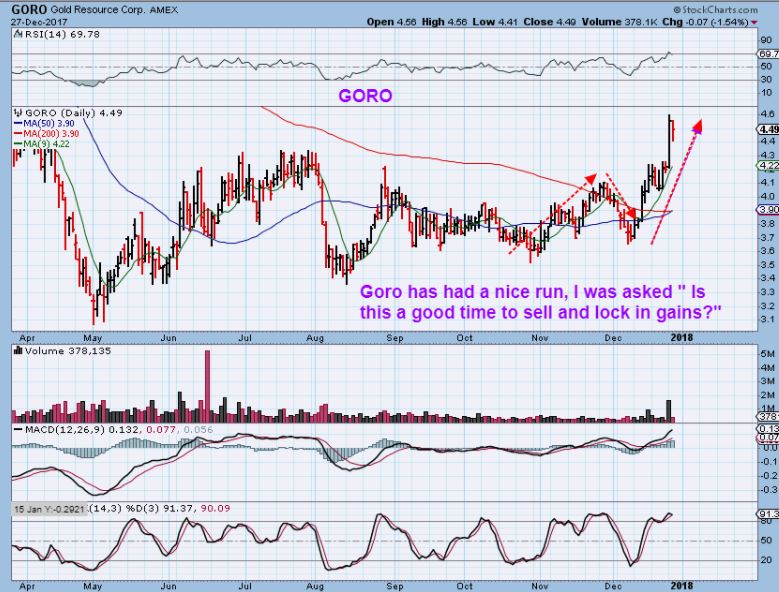
GORO – Step back and take a look at this. I just wanted to point out the LONG TERM BIG PICTURE view of a Miner like GORO. It looks like it has hardly moved so far compared to Jan 2016. It looks like a large triangle breaking out. This could actually run to $8 by the 2nd or 3rd daily cycle, based on this chart. That is almost 100% from here. I’m just holding positions and riding the waves for a few more weeks.
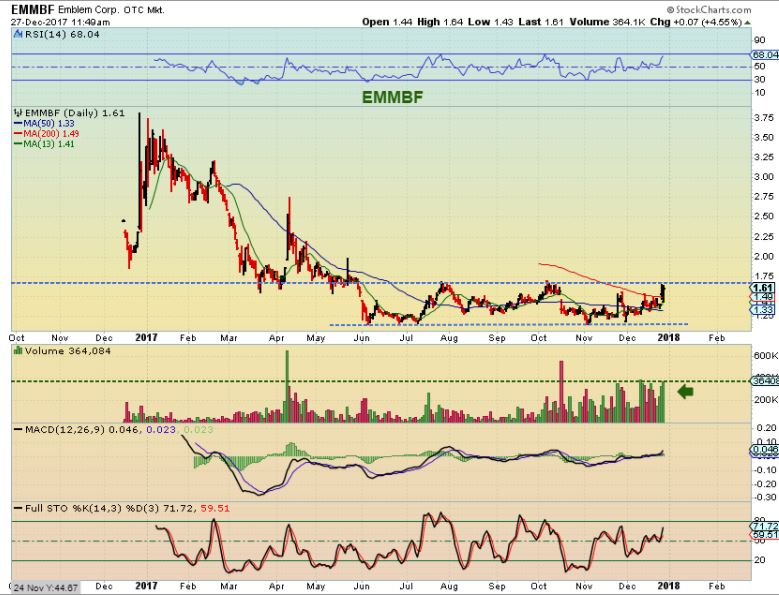
EMMBF- I found this Medical Marijuana stock in a healthy looking base and suddenly heavy volume Tuesday & Wednesday came into it. It looks ready to break out, the sector is extremely bullish for those able to trade it. $3 is a almost a double from here, on this stock.
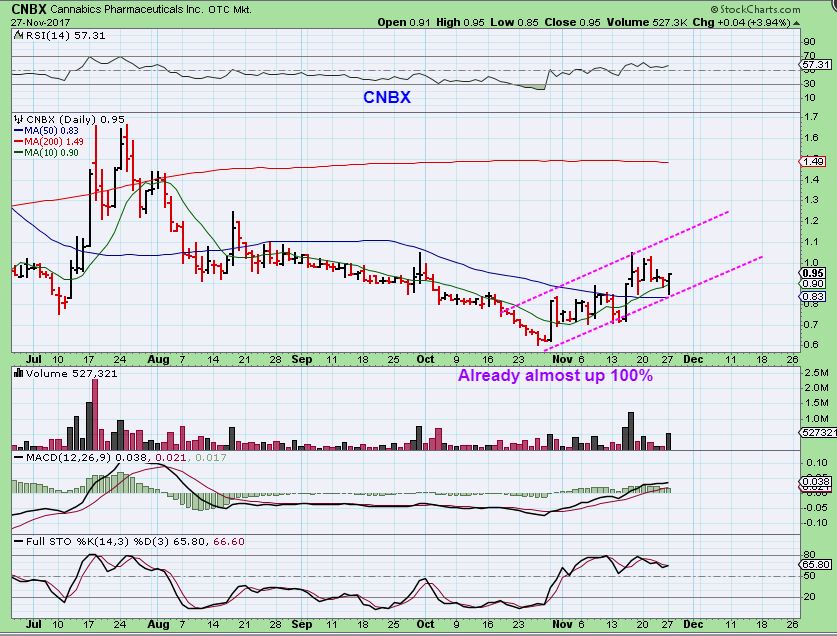
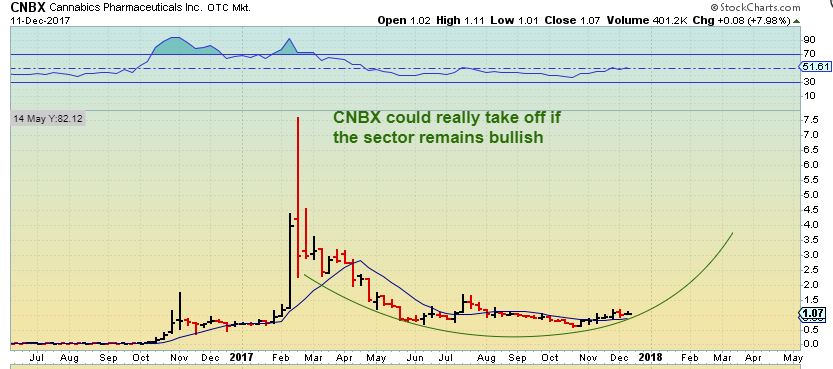
CNBX – This is the ongoing CNBX trade. You can see from my Nov 27th chart that the climb remained bullish and orderly. It was also a good place to add to current positions on the 50sma here.
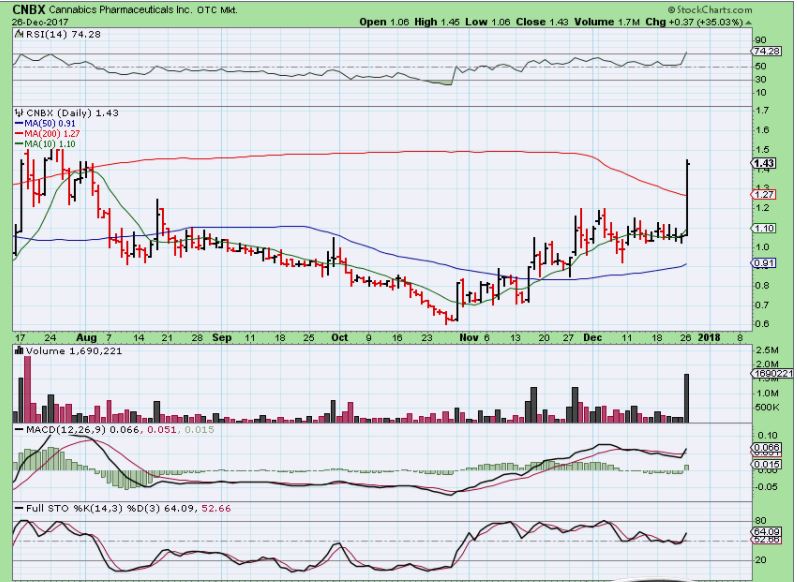
CNBX – After going sideways for a while in Dec, we got the anticipated continuation. Follow through, right up to $1.43.
CNBX – And as I pointed out on this chart on Dec 11 before that POP- the BIG PICTURE could be extremely good if the sector and chart remains bullish.
So as you can see, not much changed on Wednesday in the markets as a whole. Enjoy your trading Thursday, and following this ‘sign off ‘ is a long extensive Bitcoin / Cryptocurrency report. I will release the Cryptocurrency report to the Public later today. If you do not trade or care about this sector, let me save you some time, you can skip reading what is below, it is entirely Bitcoin, etc. If you are interested in that sector and block chain trades that we had been trading, you really should read it twice 🙂
Thanks for being a Chartfreak!
~ALEX
NOTE For the Cryptocurrency crowd
We have traded the Blockchain stocks and done very well with them, some stocks doubling and tripling in very short time periods, but I want to share something on the subject of Bitcoin or Cryptocurrency here again. Slowly but surely I have been studying BITCOIN unemotionally and unbiased as a ‘chart’, using both Technical Analysis and Cycles. I have a few friends that have been trading them ( and other cryptocurrencies) for a while, so I wanted to examine it from the viewpoint of ‘predictability’. You yourself have seen that whether it is Commodities as a whole, Steel, Copper, Aluminum, Oil, Gold, Miners, Or Biotech, Finance, Tech, The USD , etc. etc. etc. – Movement in various markets are related to human nature and that is reflected in the charts. Charts draw up the action, reactions, Greed, and Fear – The ebb & flow on a regular basis. I wanted to see if BITCOIN ( and other cryptocurrencies) reflect this well too. The results?
They do, though at this point they do seem to move in extremes at times. Just like their counterparts The Blockkchain trades, they can be viewed using Cycles and T/A with a good degree of accuracy, as long as you allow for certain variables. Since they move in extremes, they may be emotionally harder to ride longer term, but they move in waves that mimic less volatile sectors too.
As you will see here, I have actually found BITCOIN to be amazingly orderly as it follows both the ways of technical analysis, and the ways of Cycles.
MY PREMIUM MEMBERS saw me mention in a weekend report 2 weeks ago that we (Since had been trading BLOCKCHAIN trades like RIOT, GROW, SSC, MARA, etc) that I wanted to be out of all of my blockchain trades by the end of the week. Why? At that point I wasn’t sure if what I was seeing in my studies was going to materialize right away or not, but CYCLES were saying that a deeper corrective sell off ( an ICL) would be coming due by the end of January for Bitcoin, and since I was thinking that we might begin to see an A-B-C type sell off start in Dec with a ‘peak’, I needed to exit those trades. I posted THE SITUATION below twice in my premium reports 2 weeks ago, stating things like “All Blockchain trades could be cut in half”. “Bitcoin suddenly down $3000 in one night was very possible”. Yes, Bitcoin could have continued higher, but a serious drop seemed to be due. It came later that week. Please read my post below … (Click to enlarge) ….
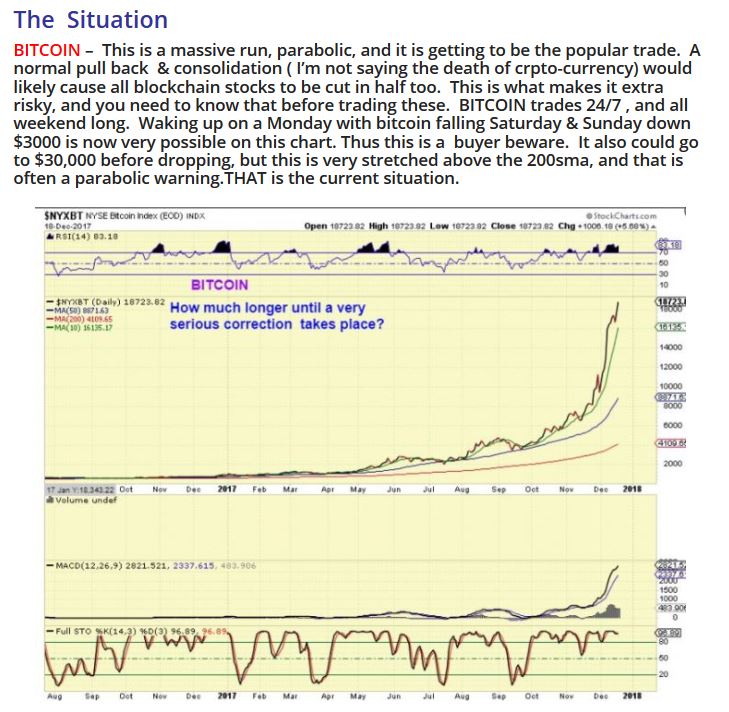
That drop started shortly after I posted that.
1. If this is a simple drop into an ICL, it should ‘reset’ and be ready to go higher again when it bottoms.
2. If this was a parabolic blow off, and it very well may be, then the ‘correction’ phase can be similar to other blow off tops. A more prolonged correction may be in the cards.
With these cryptocurrencies, the process of a correction may be a bit faster though. They do move in extremes as you will see.
NOW LET’S EXAMINE BITCOIN
In a Public report, I posted some of the following charts along with some others. I had already begun my studies at that point of looking into BITCOIN as a chart. I wanted to get a view of it as a CYCLE , and also a separate view from the TECHNICAL ANALYSIS side. Let’s start with Technical Analysis on one of my older charts …
In T/A – Bitcoin acted very well, and as seen here, ‘buys’ could be determined after pull backs break above the down trend line of a correction. Pull backs are healthy. That is pretty simple …
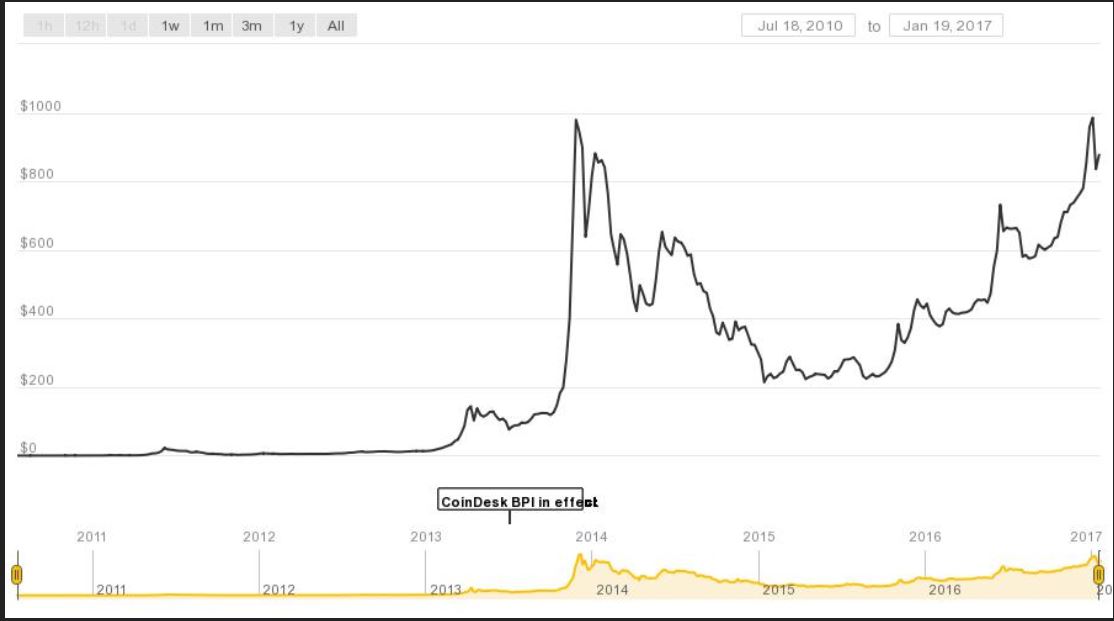
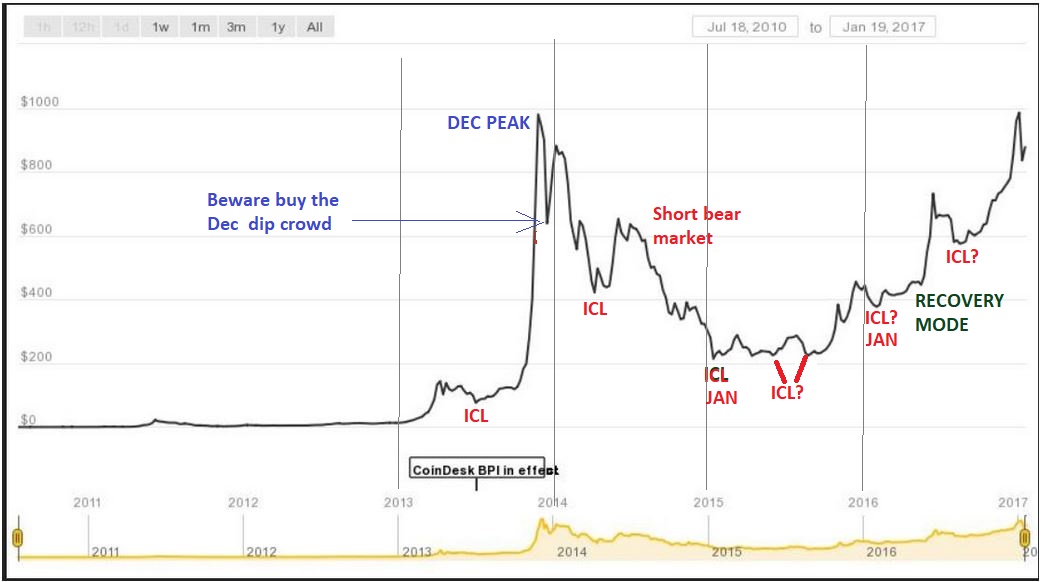
WE NEED TO GO BACK TO 2013. Notice Bitcoin in 2013-2017 – Here I was showing that BITCOIN has gone parabolic in the past, but it wasn’t any different than any other parabolic moves. It returns to Earth and then sets up a base, and begins another run later. In 2013 it ran to $1000, and that run was too sharp like the one we currently see. It eventually dipped down and based out. PLEASE NOTE: Shortly after the ‘top’, it dropped and then bounced back forming a lower high or ‘ double top.’ I am thinking that we could see that now too, so I am cautious. I will explain this idea more, later on in the report.
Notice that BITCOIN became even stronger over time, hitting over $2500 in early 2017 as it became more popular. Again, these look parabolic in real time, but later they are just ‘extreme moves’ in a bull market on these charts. NOTICE THAT WITH TECH ANALYSIS, THIS WAS AN INVERSE H&S AT $500- $700.
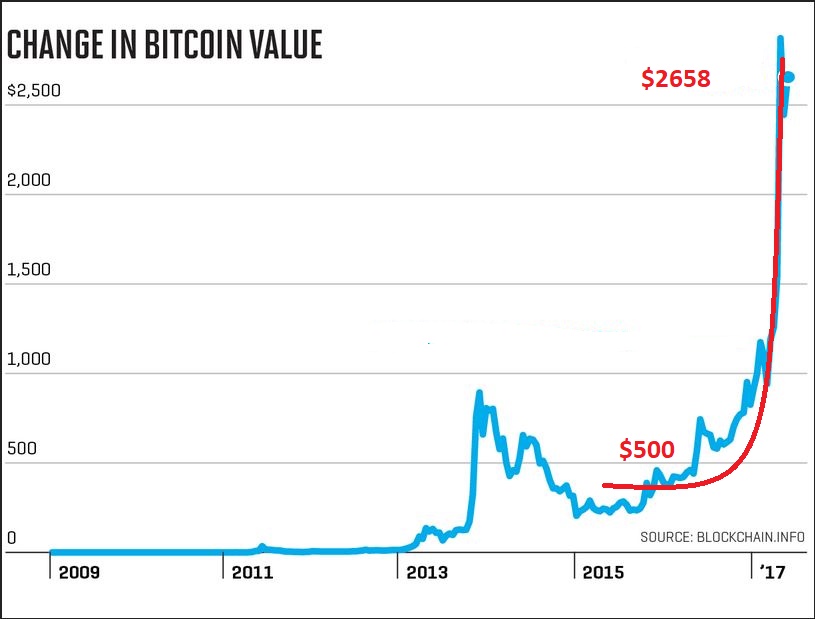
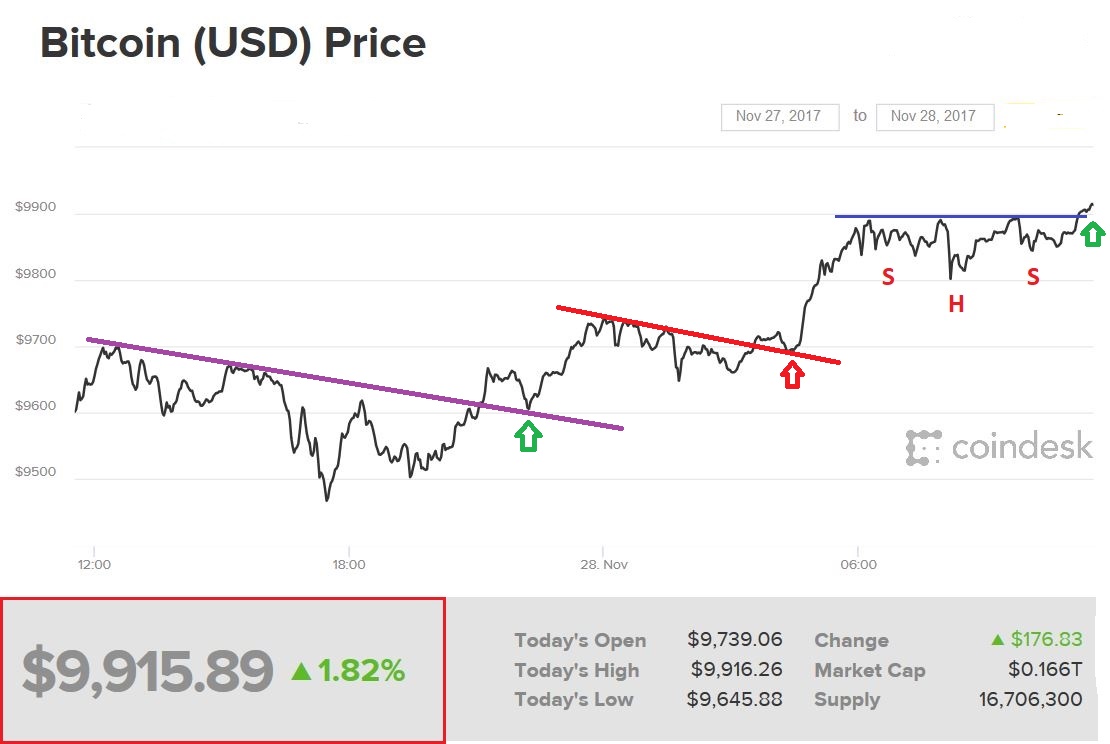
So this chart is also BITCOIN using Technical analysis in our recent months. You didn’t need to ‘guess’ where a safer entry was as it consolidated. The chart showed normal looking consolidations – even inverse H&S forming, and then break outs and perfect back tests. Bitcoin actually moves QUITE ORDERLY. It is Not an easy ride at times, because the price swings are large, but again, it was quite orderly.
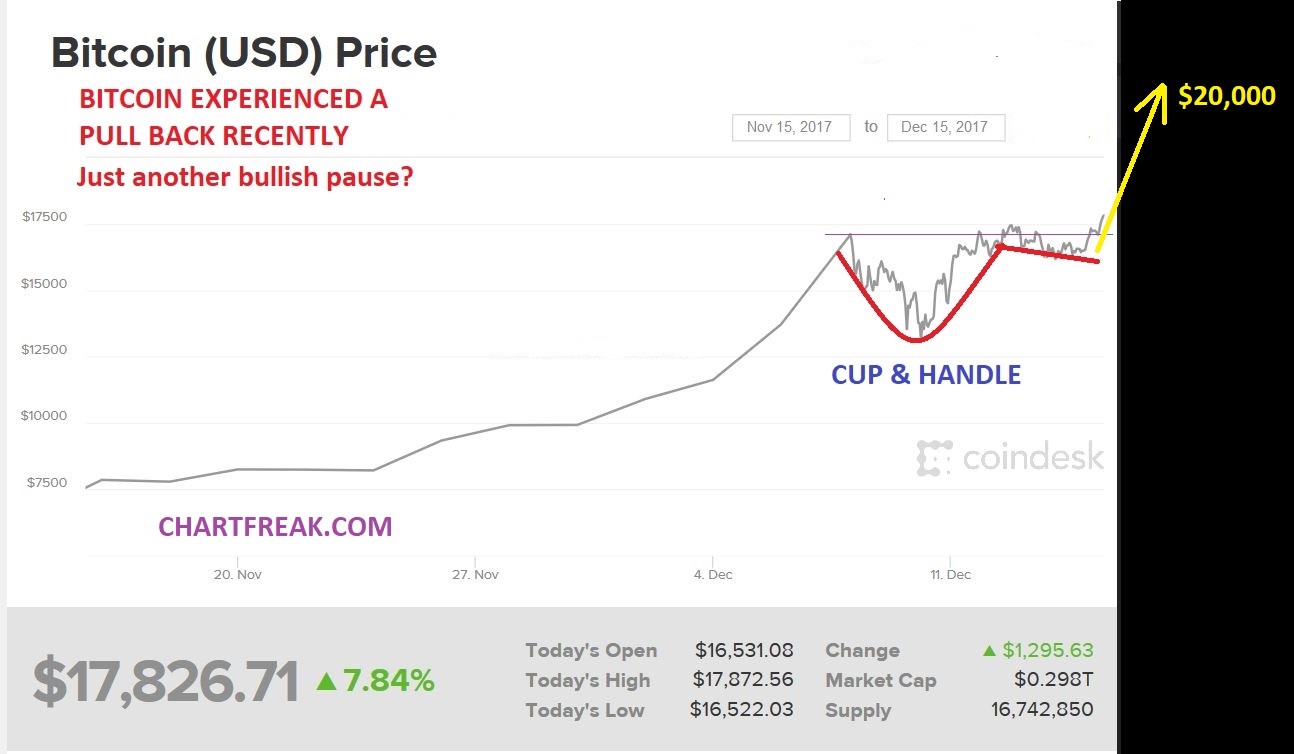
In early December, I actually used a cup & handle pattern in Technical Analysis to project that the next move from $17,000 should tag roughly $20,000, and then we would re-assess and go from there. This is where I got cautious with my blockchain trades.
So I thought that $20,000 or maybe even a bit more would be hit and THEN IT MIGHT DROP INTO AN ICL IN JANUARY, and I will discuss why.
To be honest, I was cautious at $10,000 too – big round numbers can cause a reaction, but I jumped back in after that number was easily taken out. 🙂
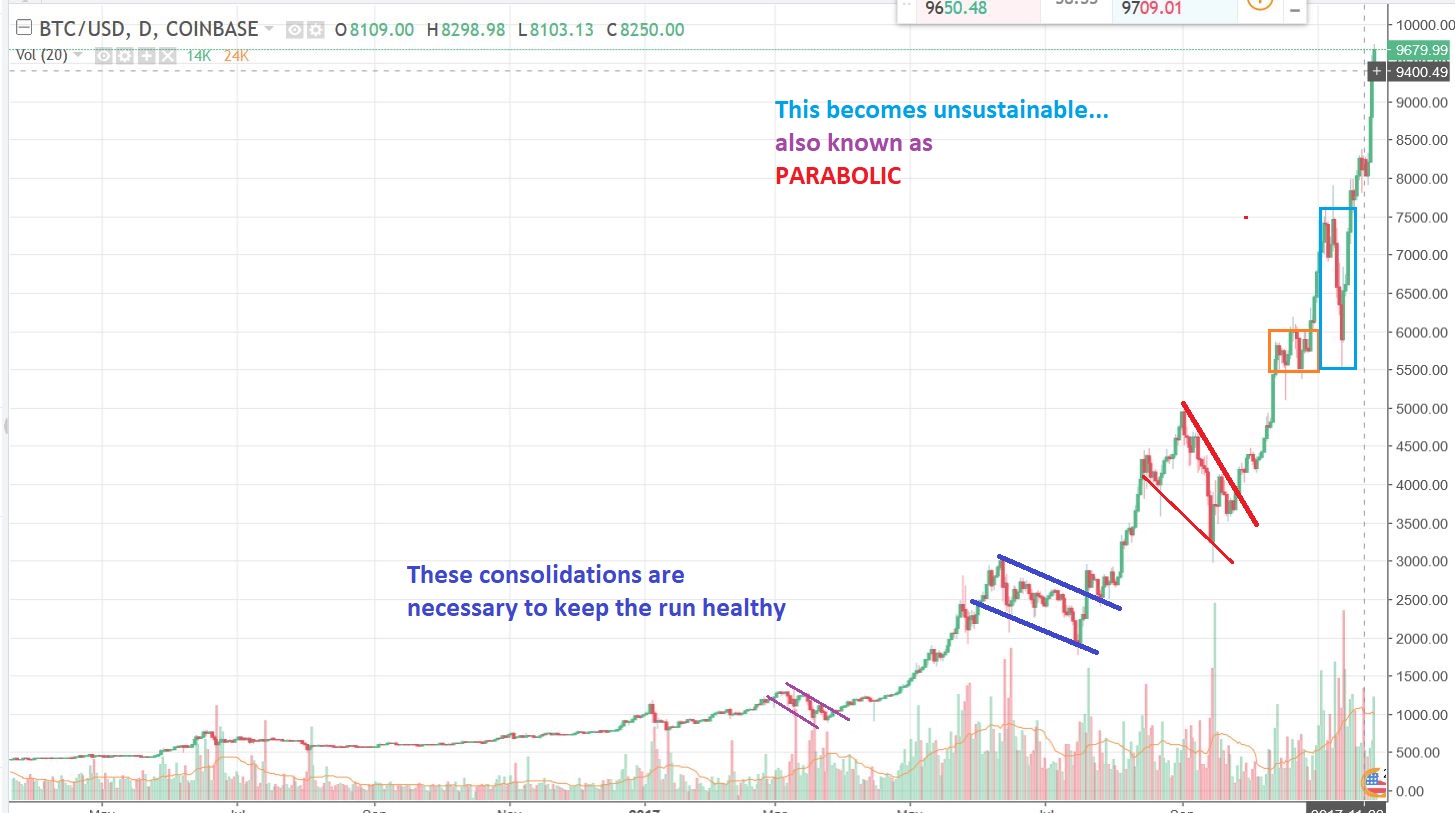
So I posted this chart in a report and asked, “Does this look parabolic?” I wasn’t implying that this is the end of cryptocurrecy, but this certainly reminds me of that parabolic run to $1000 in the 2013 chart that I posted several charts before this one. These usually are not sustainable. That 2013 run to $1000 was parabolic and needed to ‘re-set’. Let’s take a look at that chart again too …
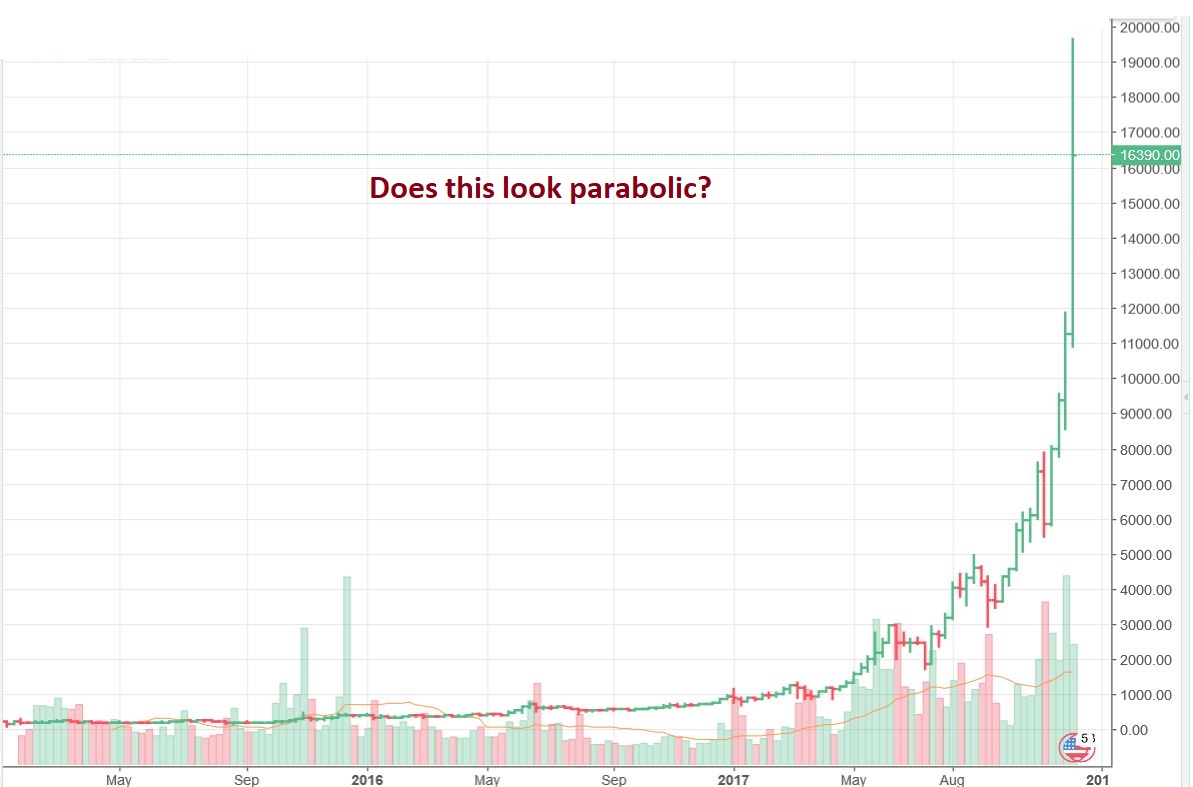
Again, this was a straight up parabolic run to $1000 (and notice that it happened in the final months of 2013 heading into December too – a double top in December). It Peaked and had to ‘re-set’. I’ll discuss this further at the end of the report…
RECENTLY USING TECHNICAL ANALYSIS I SAW THAT A MAJOR TREND LINE WAS BROKEN, and using cycles, that usually would lead to a drop into the ICL, wouldn’t it? I drew this for a friend of mine that traded Bitcoin itself. I said that he should watch this possibility – just a back test of the $18,000 area going forward. A double top in December again? I thought that if price stalls at the $18,000 area as a ‘back test’ , then a bigger drop may happen if we are due for an ICL. THIS IS WHY I SAID THAT I WANTED TO BE OUT OF BLOCKCHAIN TRADES BEFORE LAST WEEK. The trend line break was the key.
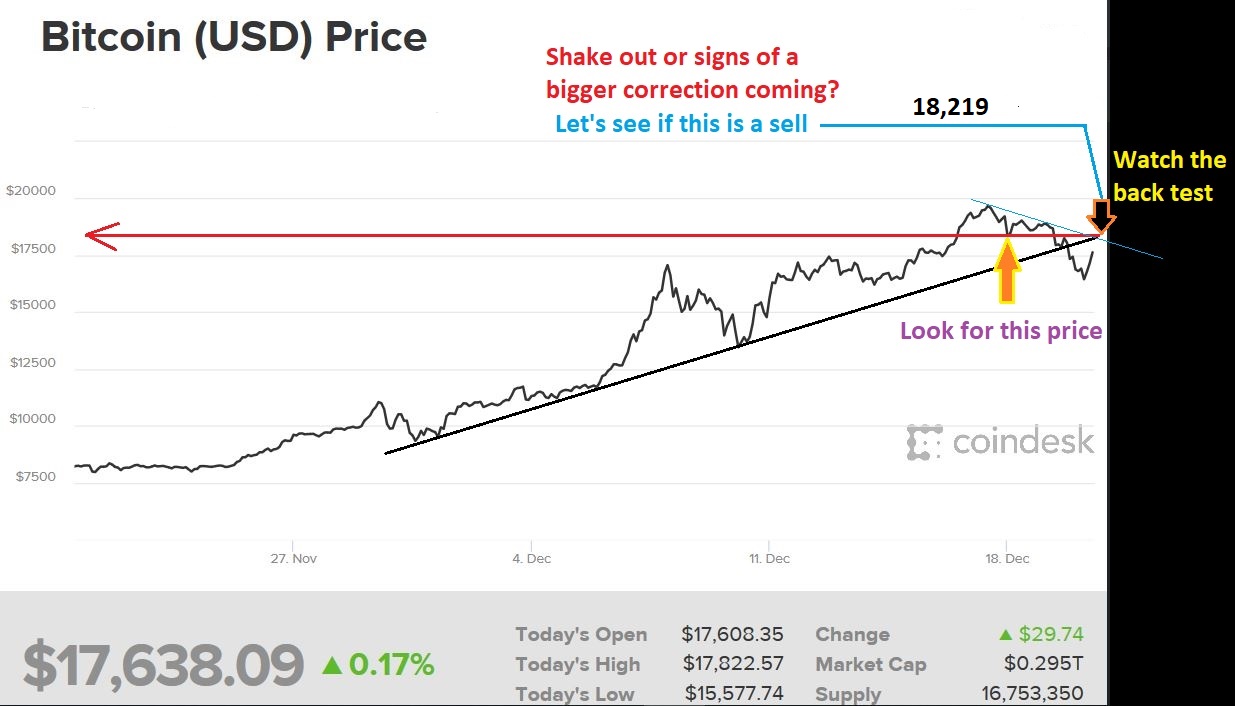
Next we got a drop from almost $20,000 to $12,500 and it seemed to come out of nowhere overnight. Look at my DCL points- This break down of the cycle uptrend did in fact have follow through. It was my first warning, and it did end up playing out. So now cycles and technical analysis do seem to be working. Will we still get the back test of the trendline & a double top or was that it? Time will tell. Let’s look at this even closer.
By the way – Patterns forming in the other crypto s like RIPPLE, EUTH, IOTA, etc, also seem to work with Tech Analysis patterns, but they also may get a bit more ‘extreme’ in the magnitude of their moves. They seem to be more exuberant and more destructive, maybe just until more buyers & sellers support the moves. ( If that makes sense)
CYCLES, TECHNICAL ANALYSIS, AND PARABOLA
These are charts that I had also drawn up that week, after the Drop occurred.
Chart #1 -THE DROP FROM 19,000 + to around $14,000 & then it Bounced.
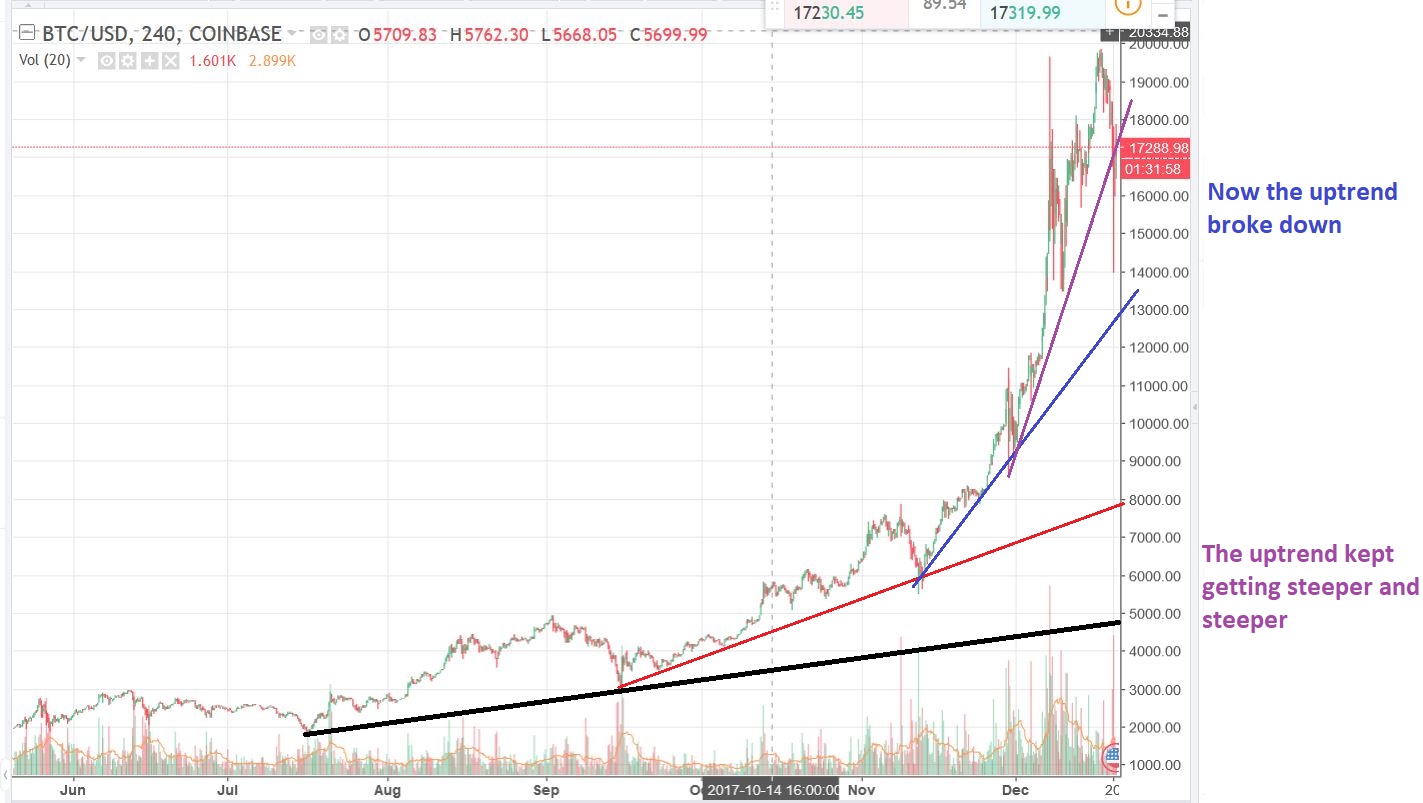
CHART #2 – The trend line break and waterfall drop to $14,000, followed by that bounce. I Circled an area that price may not get above again, a trend line back test. I am still wondering if we get there.
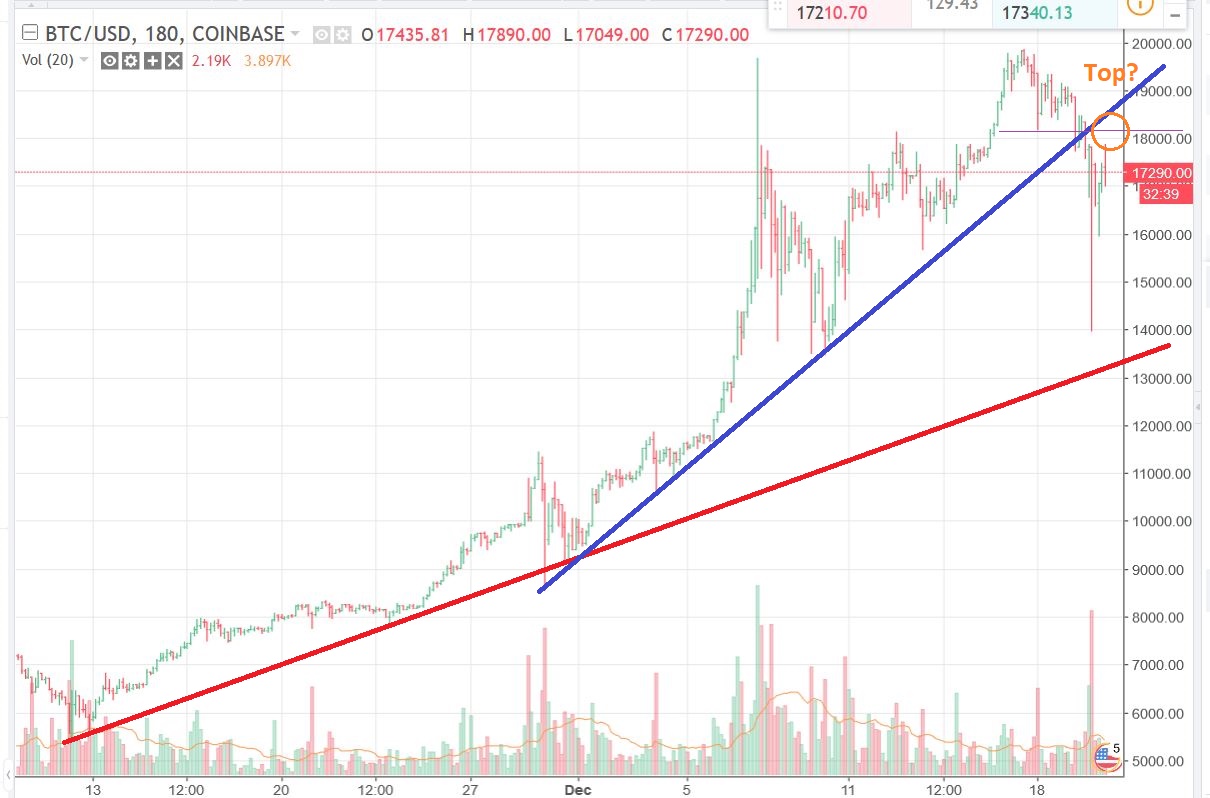
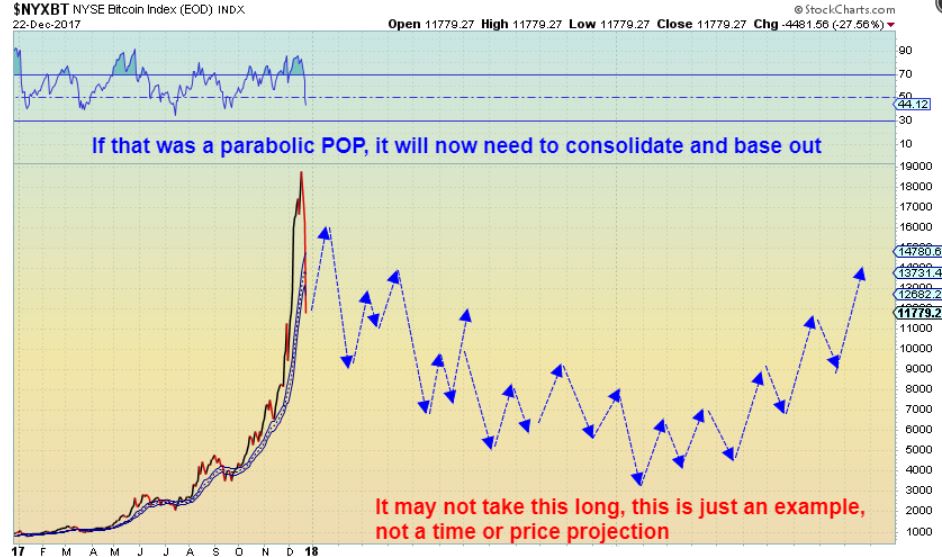
CHART #3 – Bitcoin when I started this report on the weekend. It actually did NOT bounce to back test the trend line yet, and an additional drop took place. That is now a big drop! Now we need to talk about this being a possible parabolic TOP– and that is NOT a buy the dip, as you will see. It would be time for a correction and a reset of sentiment.

LET’s TALK PARABOLIC TOPS
As mentioned, they do not mean the end of the long term run, but it may be the end of the current extended runs, until it can consolidate gains, as seen here in 2013-2015.
PARABOLA LESSONS
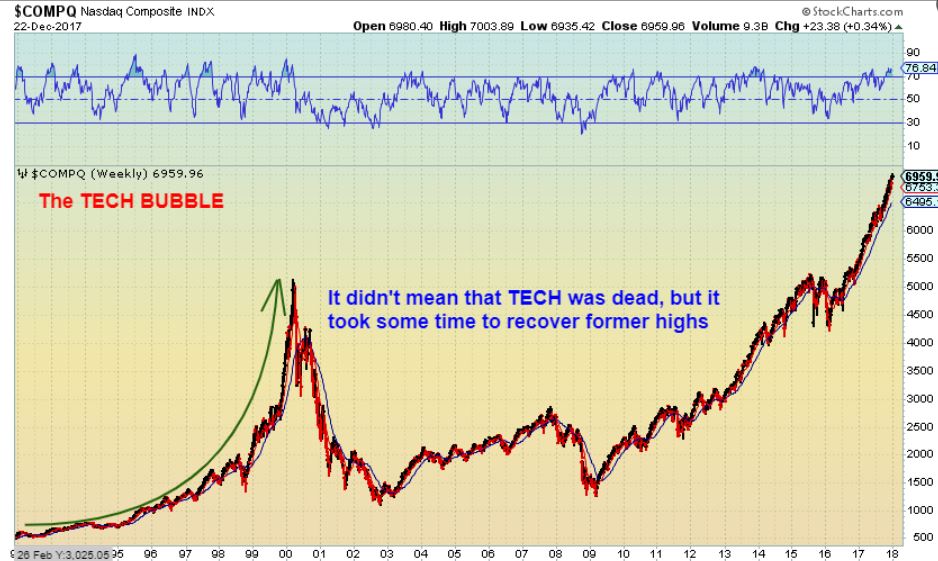
The TECH BUBBLE was a parabolic run where everyone loved Technology, Desk top P.C.s and the internet were the hot new things for everyone in the 1990’s, Computer memory chips were improving, semiconductor stocks were very Bullish, Data Storage companies, etc were all “The thing of the future” and thus people thought that this market will never pull back or correct. Yes, many thought that because it was ‘the future of business’ – it would just keep running higher & higher. History shows that Bubbles are extremes in emotions and dangerous when they get overdone. They do correct, build a new base, and then even that Tech Sector returned to those highs and still has a bright future. Post Bubbles are tough for the ‘Buy & Hold’ crowd though. Notice the double top with a lower high the second time.
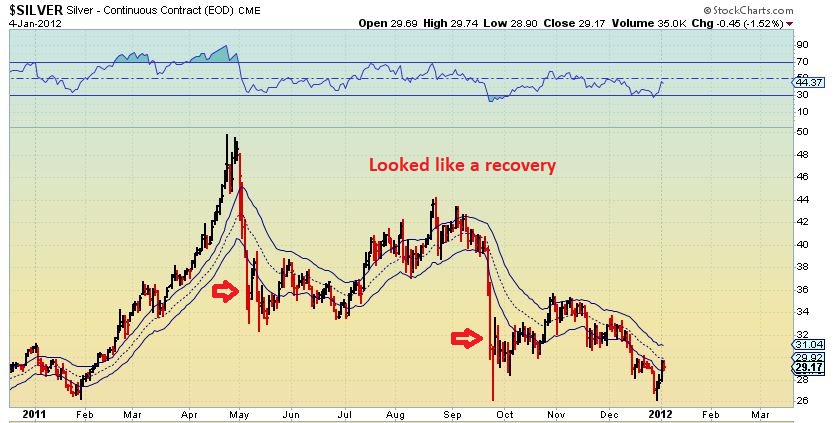
Using Silver as a historical fact – I just wanted to point out how exciting a Bull Run into Parabola can be, yet how destructive the correction can get. Silver ran from $25 to $50 in 3 months in 2011, and many people were saying that ” Silver is not just a precious metal. Silver can be used commercially too, unlike Gold, so it’ll run to $100 and never see sub $40 again!”. ‘POP’ – it double topped & dropped too. Then built a base.
And when I posted this chart below, it was because everywhere I looked, everywhere that I read about Bitcoin or cryptocurrency, I am hearing that EVERYONE wants to own it to get rich. I’m hearing that Bitcoin is going straight to $50,000, then $100,000 and then a million, etc etc . I do believe that Bitcoin & cryptocurrency will play an important role in the future, but there will be bumps along the way ( probably quite bumpy when the GOVT’s get involved). So lets look at BITCOIN even further …
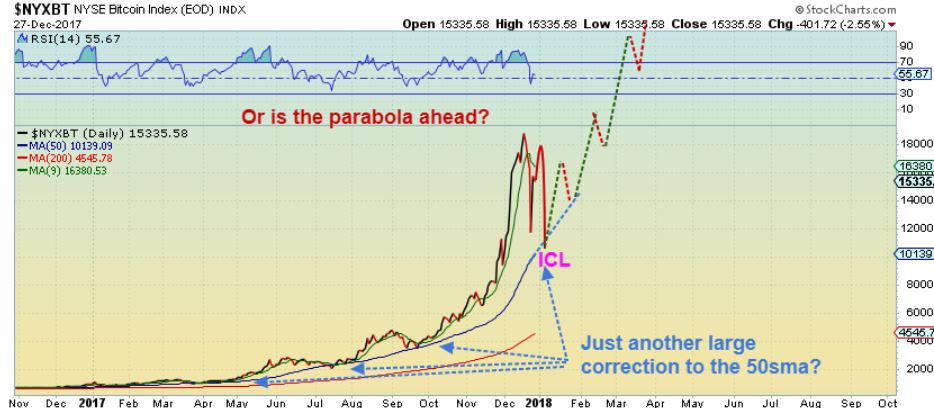
From Dec 27– I’m watching for 2 scenarios, though I tend to lean toward the first one.
#1 – With our current Top in place in Dec, followed by a double top after this bounce, we would see a drop into an ICL in January that starts a longer correction down from a parabolic top.
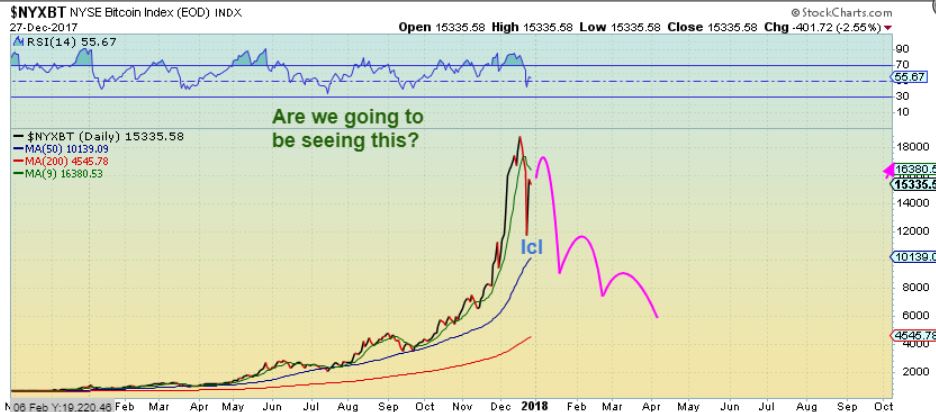
#2 – This would be a normal pullback in January and then a continuation of the run higher. You can see that this makes the current ‘top’ look less parabolic & temporary like the other recent ‘peaks’. I must say that the recent euphoric ‘everyone & their grandmother is talking about bitcoin’ type run seemed more parabolic to me. I am cautious going into January.
A close up of the recent drop.
IS THIS JUST A TREND LINE SHAKE OUT? It is Possible. This trend line was broken & recovered, so it is possible that buyers are stepping in again, but I would watch for a double top and raise stops immediately if you are trading blockchain again.
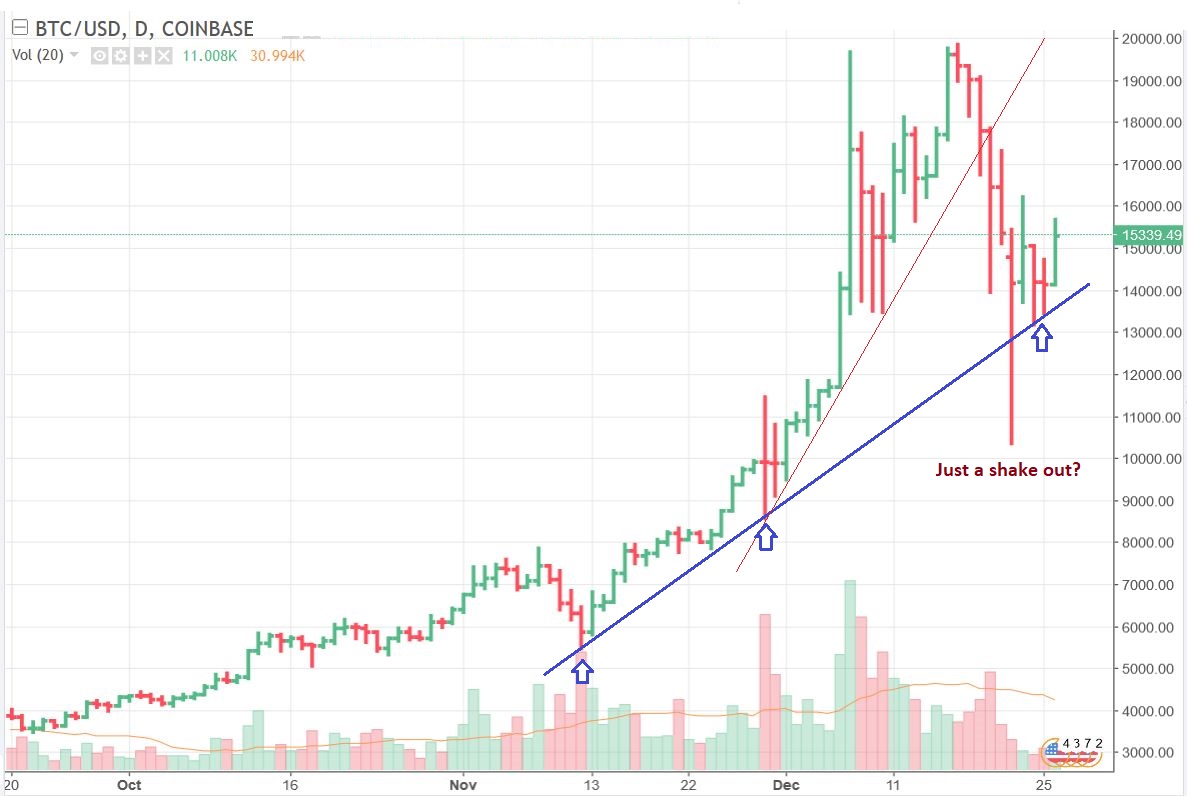
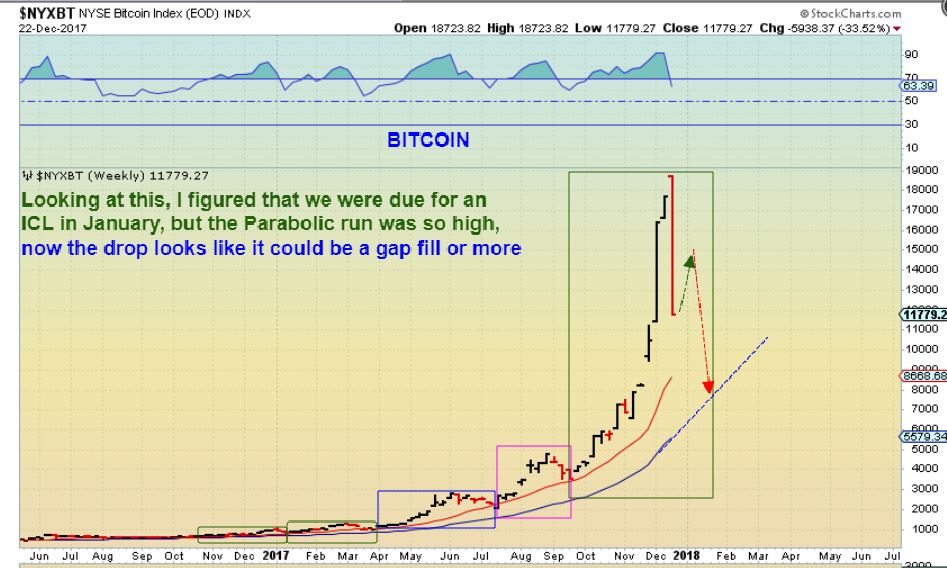
This was actually my chart from Dec 22 before the bounce. BITCOIN trades 24/7, but notice that the weekly stockcharts chart shows a big move in November caused a gap that may fill on this chart at the 50ma on an a-b-c type drop.
CAN WE TALK ABOUT CYCLES AND TECHNICAL ANALYSIS GOING FORWARD TOO?
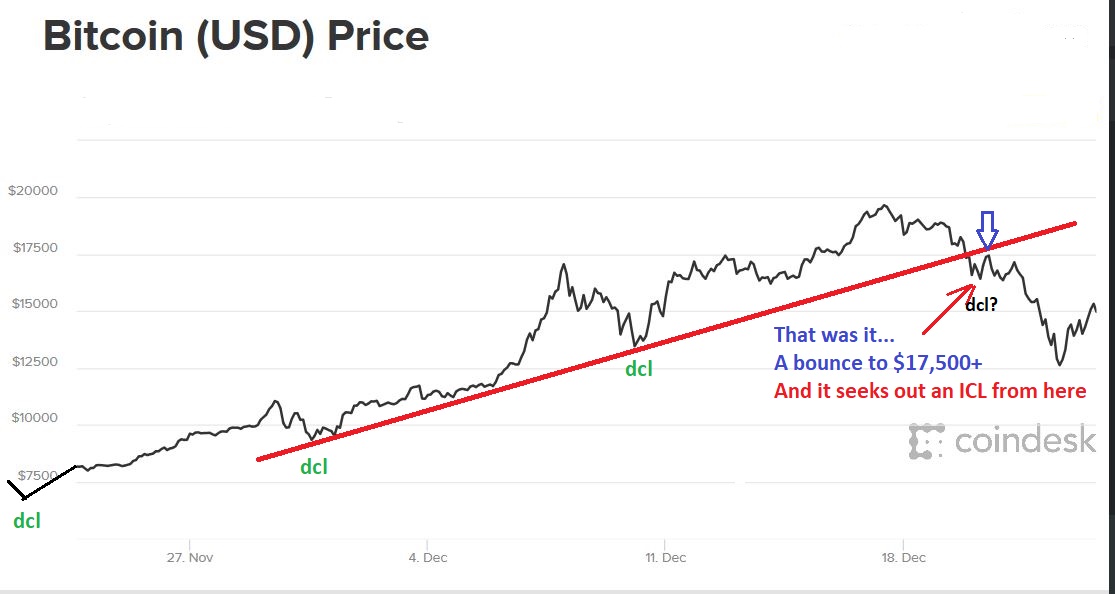
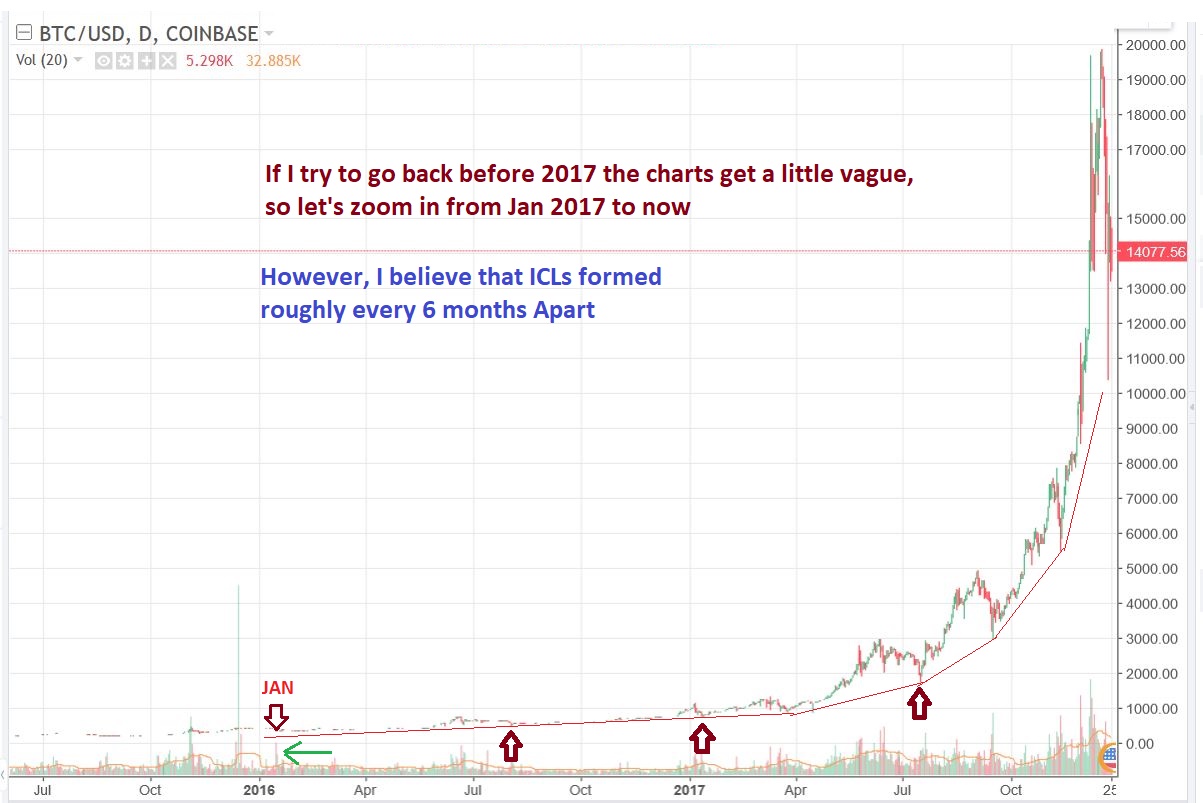
I find that using this charting service, my charts get too vague prior to 2017. So for starters we have this vague one simply to point out what I would think are ICLs, and then I will zoom in. Please notice that ICLs ( Deeper trade-able lows) look rather faithful to roughly Jan, July, Jan, July. See the arrows. So we get one in January?
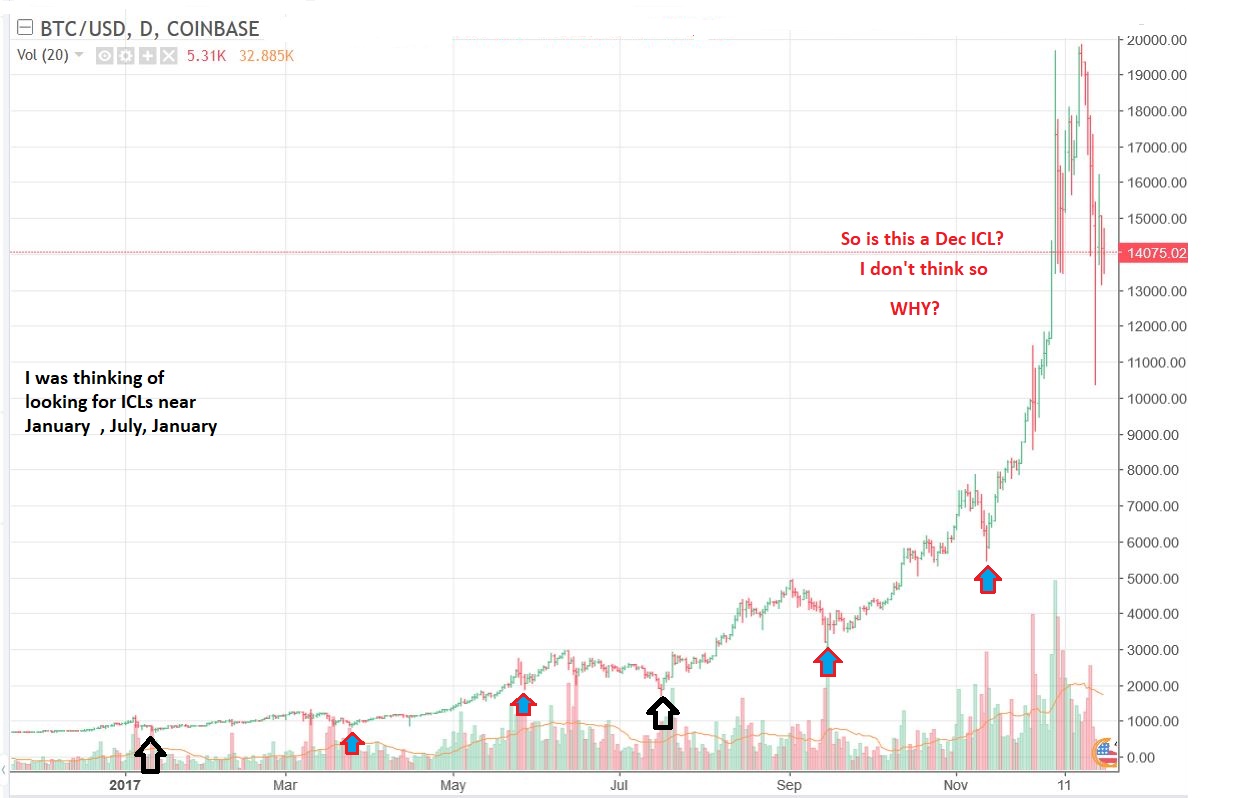
With that Jan, July, Jan, July ICL pattern– I was thinking that we would get a deep low in January. So was this DEEP DIP in December the ICL? is this now a ‘buy the dip’ opportunity? Or is this just the start of a topping process? I think we are seeing a topping process personally, so I became cautious.
I also drew this on the weekend, and it shows why I am cautious, even with a bounce. I think that we may get a bounce into January and then the real drop into an ICL. See the chart.
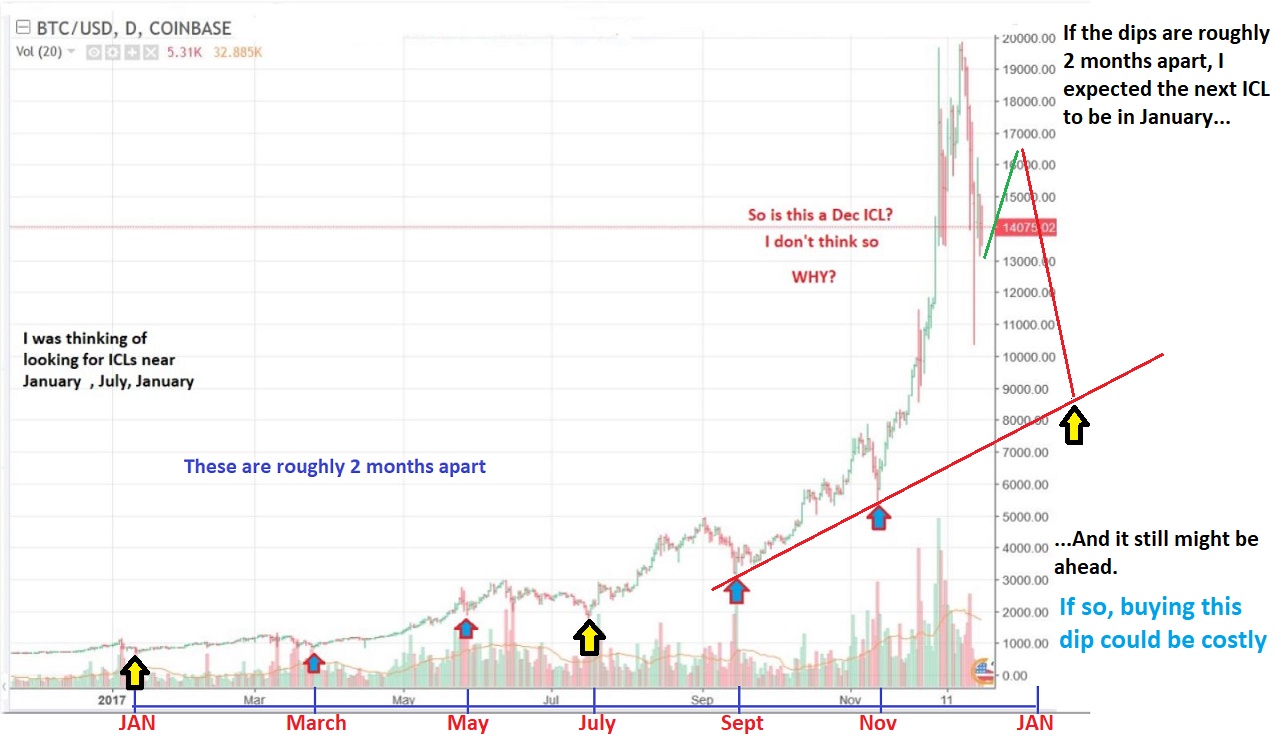
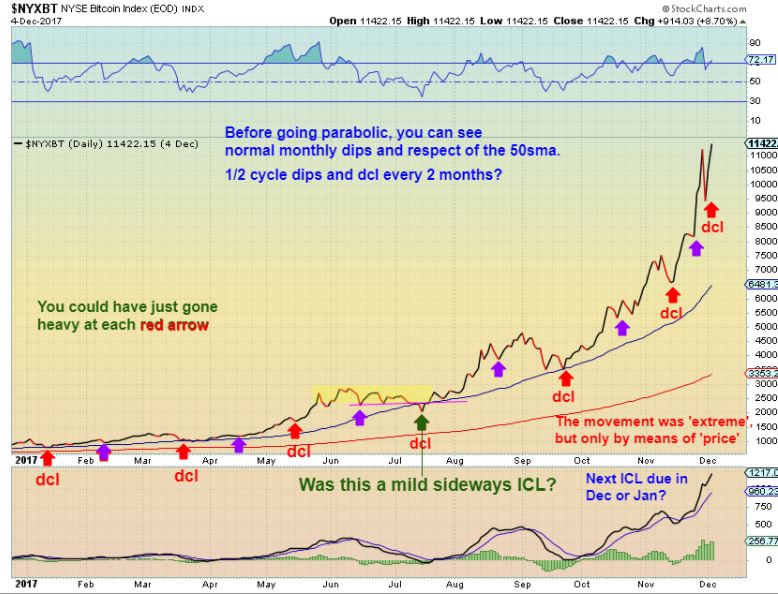
My chart from Dec 4th as Bitcoin went parabolic. Notice the pattern of dips look ( to me) like DCLs ( ‘Red Arrows show the Daily Cycle Lows‘) and then 1/2 cycle lows in purple. Again, I’m thinking that an ICL in July should lead to an ICL in January.
BONUS CHARTS – DOES THIS REMIND YOU OF WHAT WE HAVE RIGHT NOW? That 2013 Parabolic Peak actually looks to have peaked at the same time of year as our recent one. I’m showing the probable ICLs that followed after bitcoin peaked at the year end. Bitcoin peaked in Dec, dropped, bounced into January and that was not a good ‘buy the dip’ low either. It sold off again and the ICL’s became lower lows until the consolidation finished.
I drew this to show you what happened in the chart above basically, if it were to happen now. It needed time to consolidate after the parabola. Some Blockchain trades may still work, others might fade away as junk. Please read the RED writing on the chart.
We traded the daylights out of blockchain trades like RIOT, GROW, MARA, SRAX, SSC, etc. etc. etc., and with bounces in Bitcoin, no doubt they will continue to put on some big %-Gains.
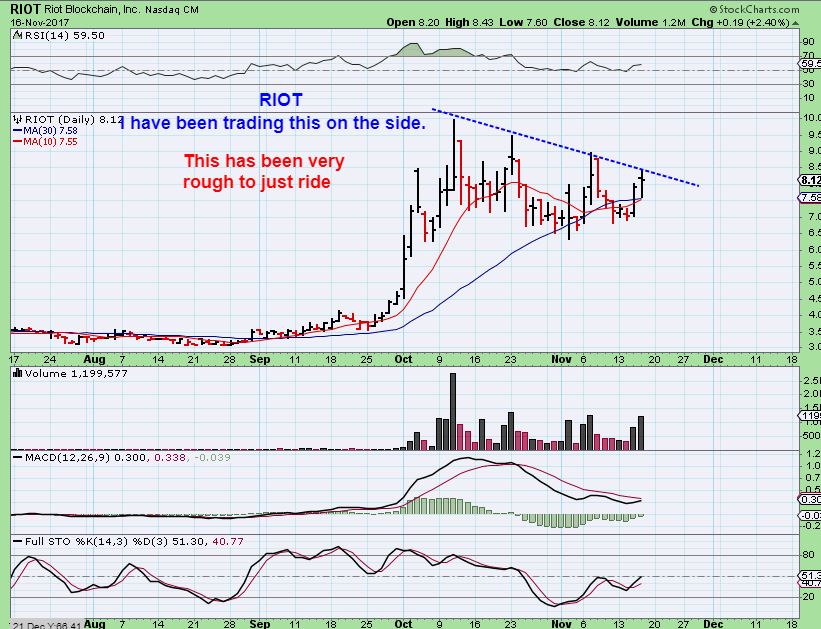
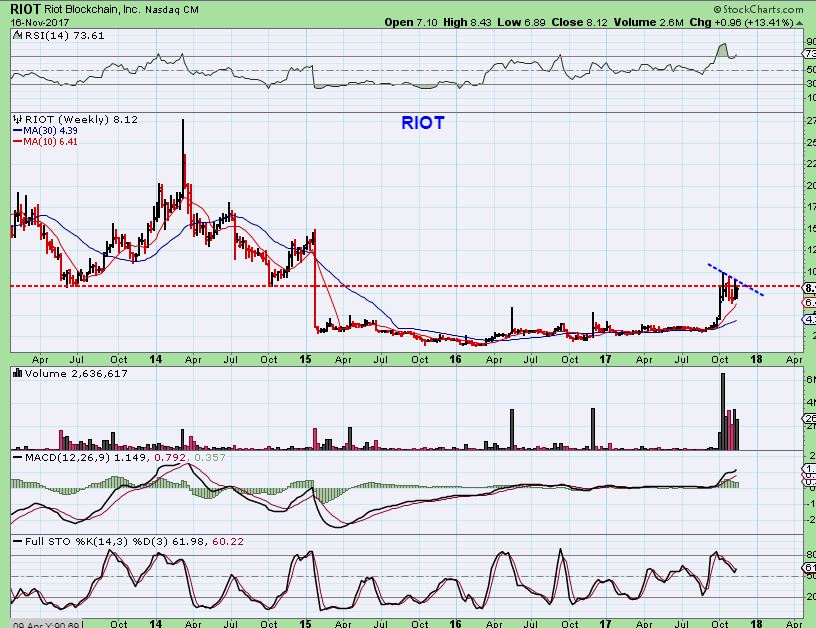
These were my BUY Charts for RIOT, and it ran into the $20’s from here ( Even higher after I sold.). Technical analysis did work well on all of these blockchain set ups, but for now I am cautious .
CONCLUSION: I think that BITCOIN was due for a December top, and the next deep low would come about in January. That means that my analysis is telling me to be cautious, BITCOIN may have already topped near $20,000 – very similar to that 2013 top.
For the Public readers:
At Chartfreak, we have been re- focusing on a few other areas, particularly Precious Metals for the past month. So far we caught the lows after the FED meeting and have been riding a strong move higher. We also have other trades on that are currently up 20%, 40%, even over 60% in mere weeks in a different sector. As for the Precious Metals, Some individual Miners set up early, and others continue to set up, as GDX & GDXJ melt upward day after day at this point. I am watching from the sidelines for now with the cryptocurrencies. I want to see how Bitcoin / Crypto- sector plays out further. It has been a breath taking run to say the least, but with the type of moves that it can make ( both upward or down), I don’t want to ‘guess’ at what’s next – I want to allow ‘The Charts’ to tell me what they really wants to do.
If you think that this type of analysis, in addition to your own study, would help you to navigate the markets better, why not try us out? We offer a 1 month plan, or a discounted quarterly or yearly plan. We also have a live chat / comments area where other experienced traders share ideas through out the trading day.
Chart Freak Premium
Chart Freak members receive up to 5 premium reports per week covering a wide array of markets. Come and join the ChartFreak community as we trade the next run in the Gold Bull Market and various other trending sectors.


really nice work on the $BTC analysis! really nice! Thx.
Thx Deshy – I appreciate that.
It honestly took a long time to try to word it so that what I was seeing in my head could be explained.
Took longer than I thought.
Great in depth report CF… Much appreciated.
Thx BT!
DING DING DING- I have to go watch a few things 🙂
BITCOIN VS BLOCKCHAIN…. Alex very long report on bitcoin…can you please summarize your feelings on Bitcoin for us? also what about BLOCKCHAIN STOCKS like OSTK, PRELF BTLLF GROW?
Thanks Alex!
Honestly, I don’t know where you find the time to do such great detailed work!
Have a great day!!!!!!