I wanted to open up a slightly shortened version of this weekends report to the public. In the weekend report, I usually cover the action that we saw in all of the Sectors that we have been covering lately, and in the daily reports, these are updated and stock picks are also added, if the set ups present themselves. So even though the premium members will have a lot of additional information as things upfold, the Public should be able to get a solid idea of what we have been looking for, and how it has all been playing out. Enjoy this weekends report.
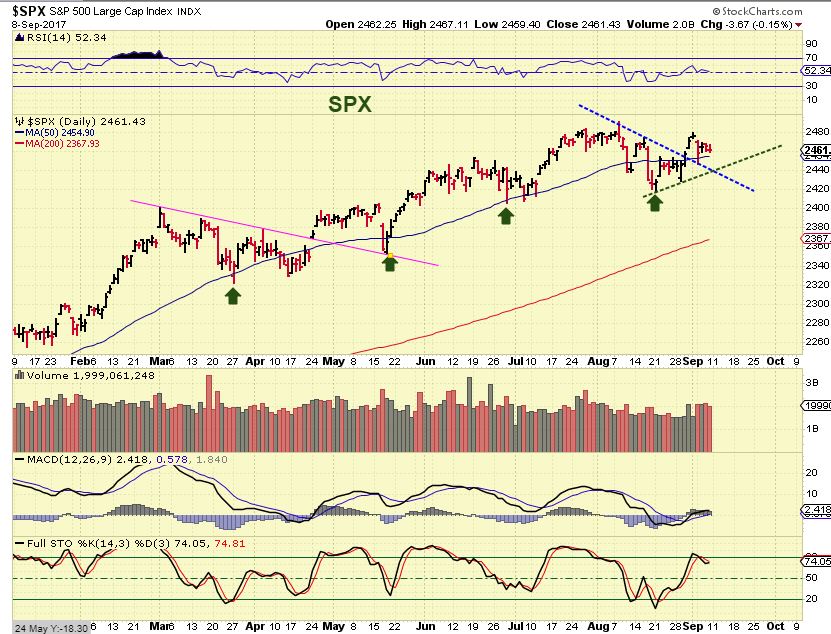
SPX– I will repeat, I never called the recent dip an ICL. It lacks the characteristics of one, but what I did say is that we have been overdue for one for a while. So we have a dcl, and similar to the last couple of dcls, the move higher has been a bit choppy, but we have higher lows and higher highs, so an uptrend continues.
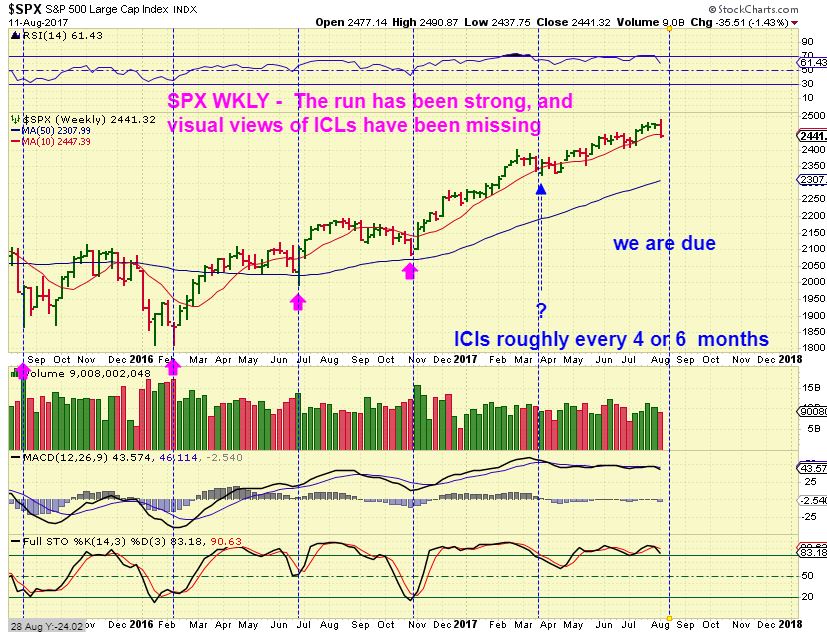
SPX – In August I reminded readers that we were due for an ICL, but visually, I still do not clearly see one.
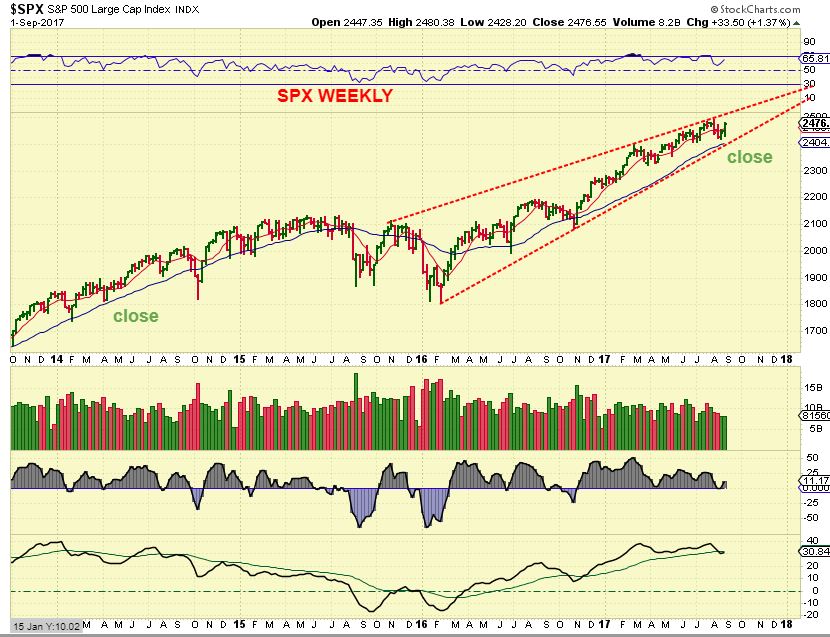
SPX – Then on Sept 1st, I posted this as a cautionary note for the future – a possible rising wedge and mentioned that OCTOBER can be tough for the markets, historically speaking. We have seen some pretty big crashes in October. Will we get the ICL then? We’ll have to be alert going forward to any signs of weakness as this unfolds. So some are long from the recent dcl, I am just helping my readers to see a reason to stay alert, and I will monitor it along the way.
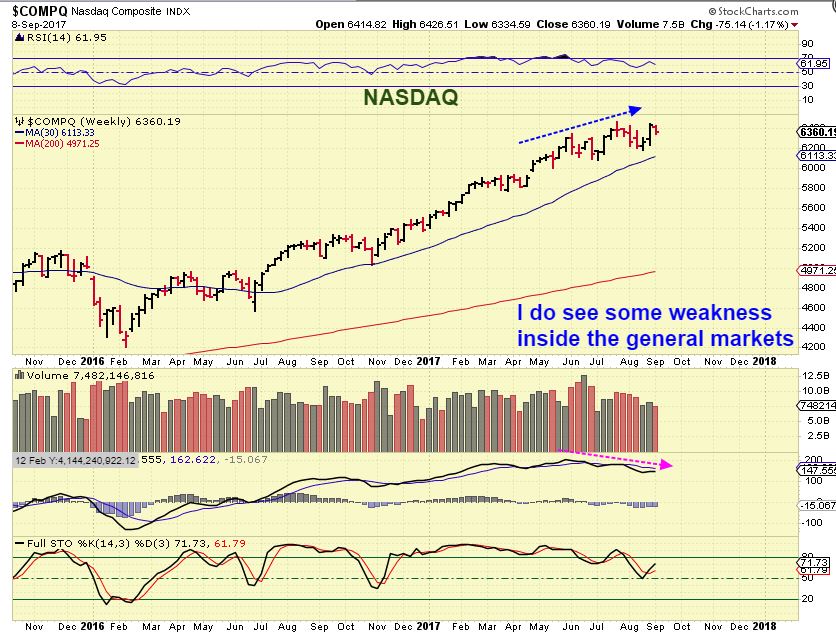
NASDAQ– I Do also see weakness internally in my Nasdaq Wkly Charts, as the Nasdaq attempted to push to new highs again. This looks a bit similar to Oct 2016, when the markets pulled back into the ICL ( into U.S. elections) but then it took off higher.
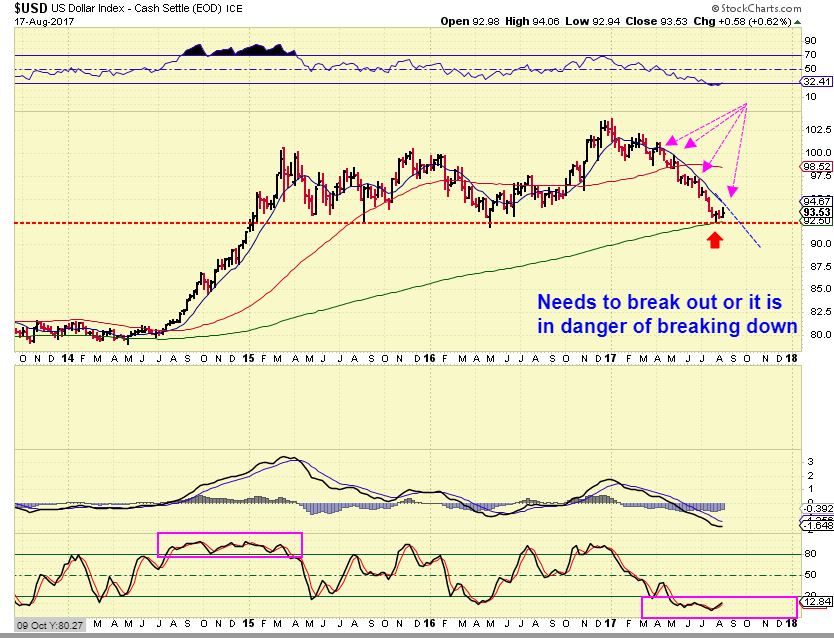
USD – In August, I noted that the USD was at a support area, but in danger of breaking down. Watch this area & blue line, because in the last 3 years, there is not a lot of support below this area.
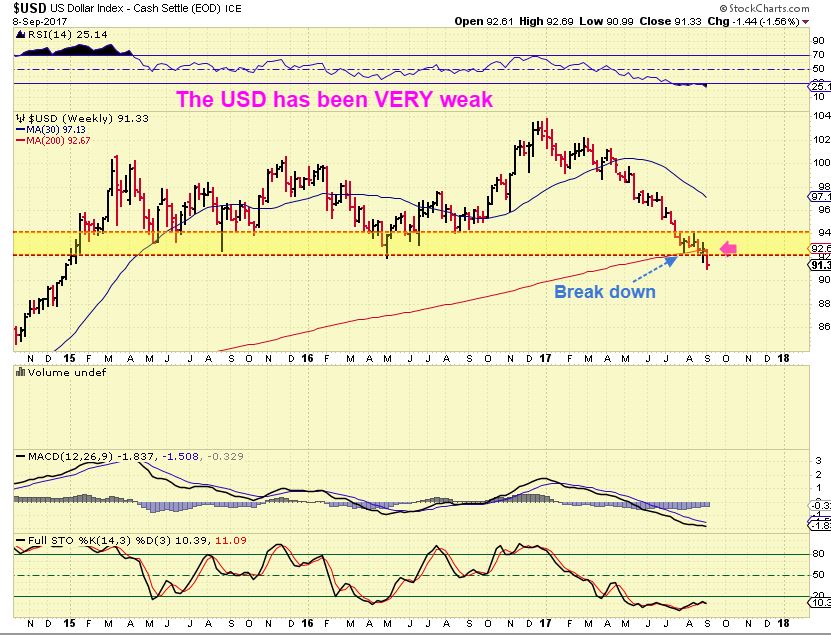
USD– And the USD broke down this week. If this drops further, Gold could get to that $1375 area that I have been thinking it should reach sooner than later. I will cover the USD further in future reports.
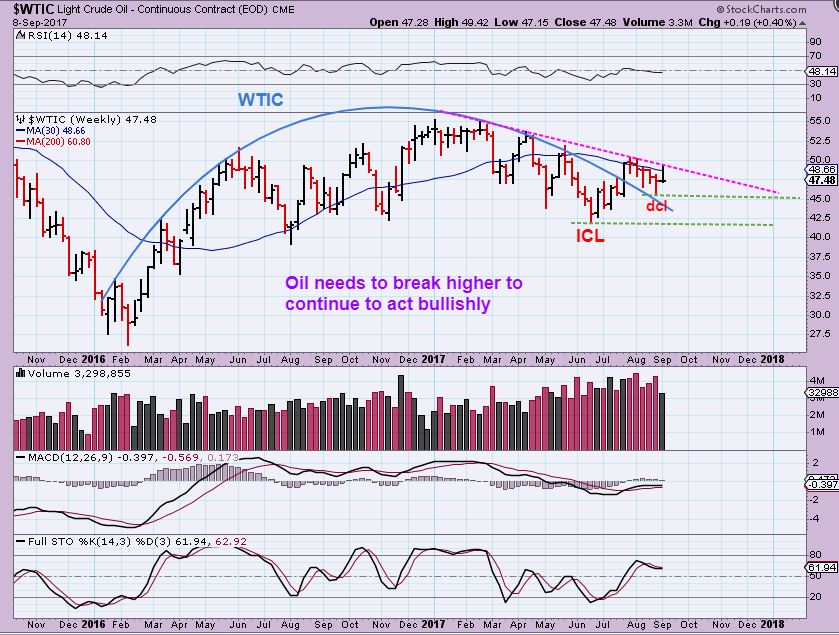
WTIC- Oil looked very good since the June lows, but it is stalling here and needs to push higher above that Magenta line. I pointed out the ICL / YCL in June as it happened, and then a dcl in August. I would have a stop under the dcl green line if I was long Oil.
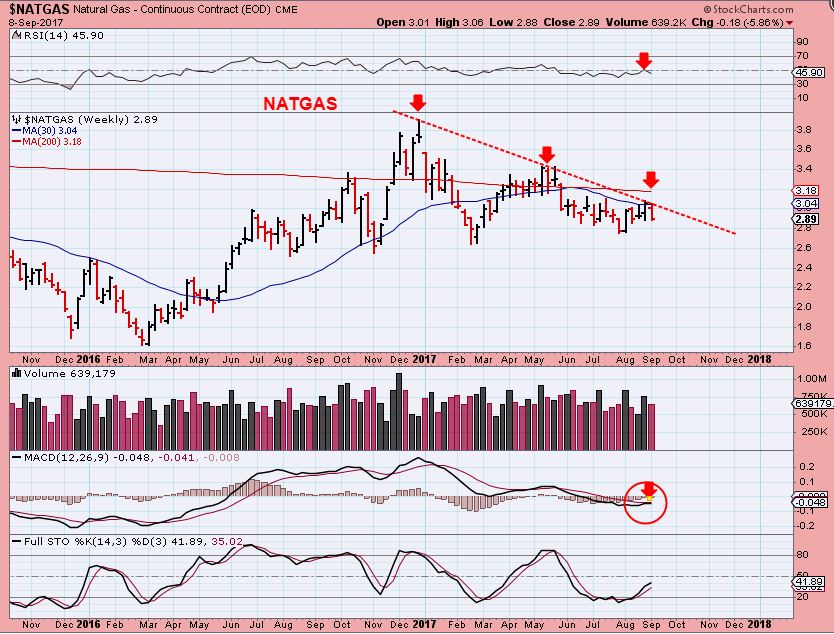
NATGAS- Natgas has been choppy and too hard to trade long & short recently. There is a lower trend line ( not drawn) and an upper one. A break of either line may start a more sustainable directional move.
GOLD, SILVER, MINERS
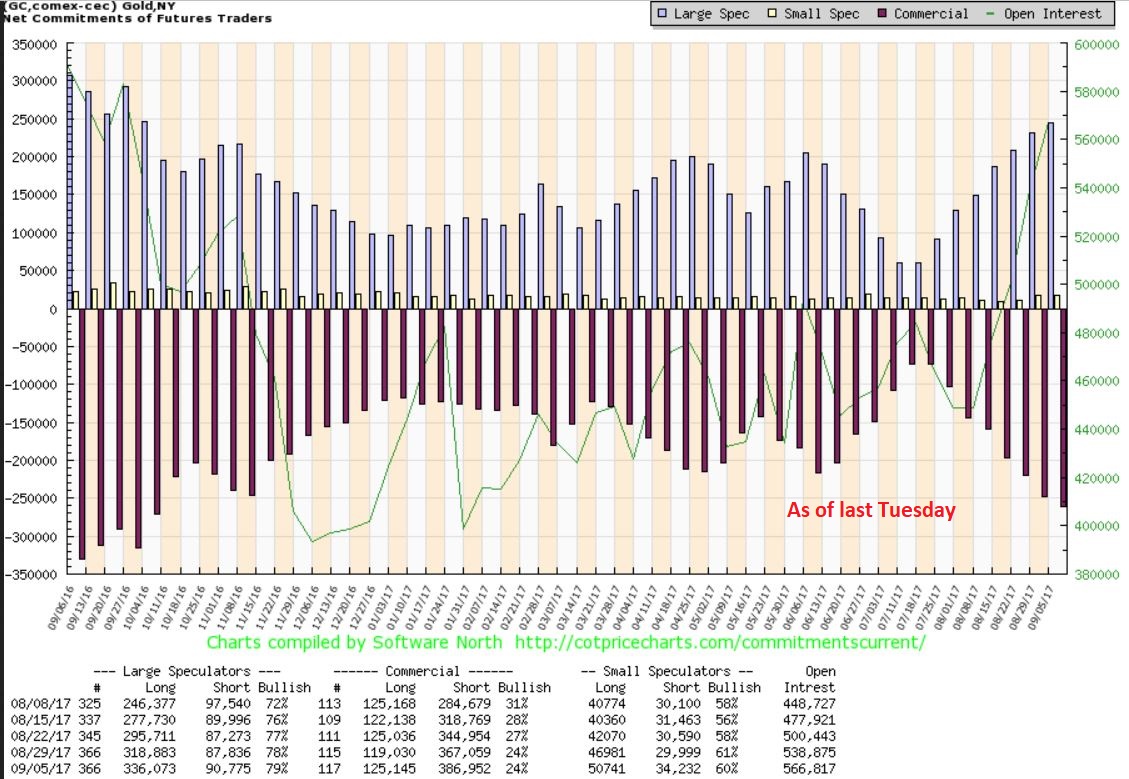
COT– This reading is as of last Tuesday, and as you can see, smart money shorts continue to grow. That said, I mentioned weeks ago that I DO NOT use this as a timing tool, and we were not shaken from our trades in this sector.
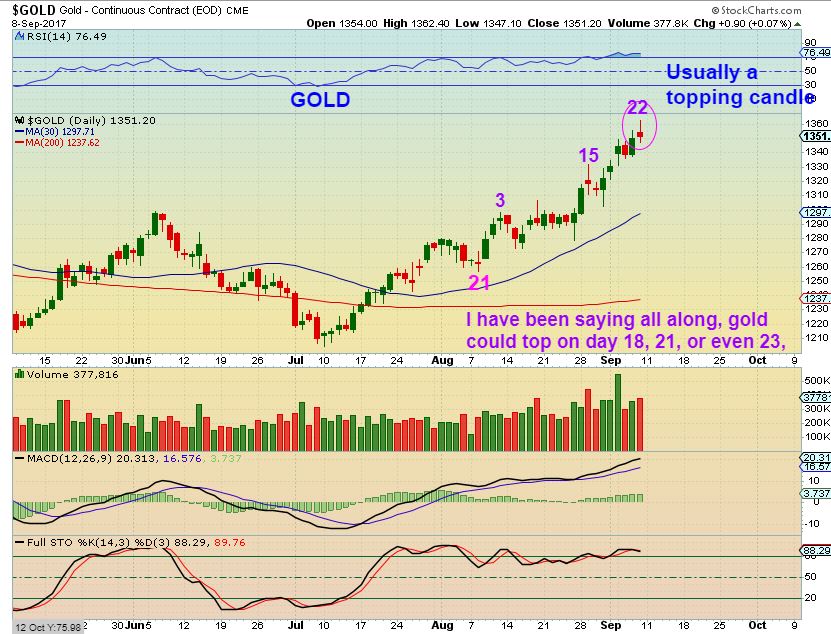
GOLD– After calling the ICL & YCL in July, the first leg higher pulled back into August. I labelled this a DCL on day 21, and was all alone on this call for a while. On August 23rd, I pointed out that I thought that we still had further to run, and I felt that we should break above 1300.
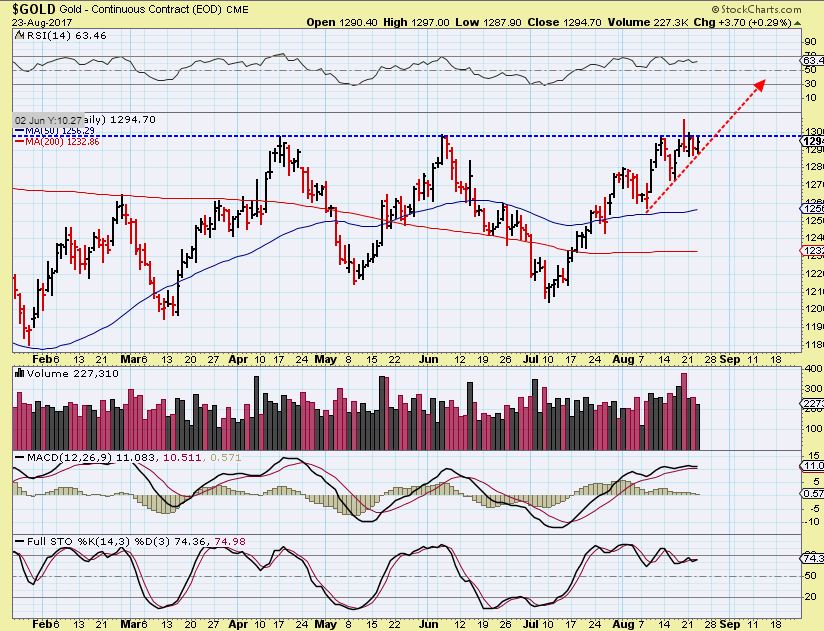
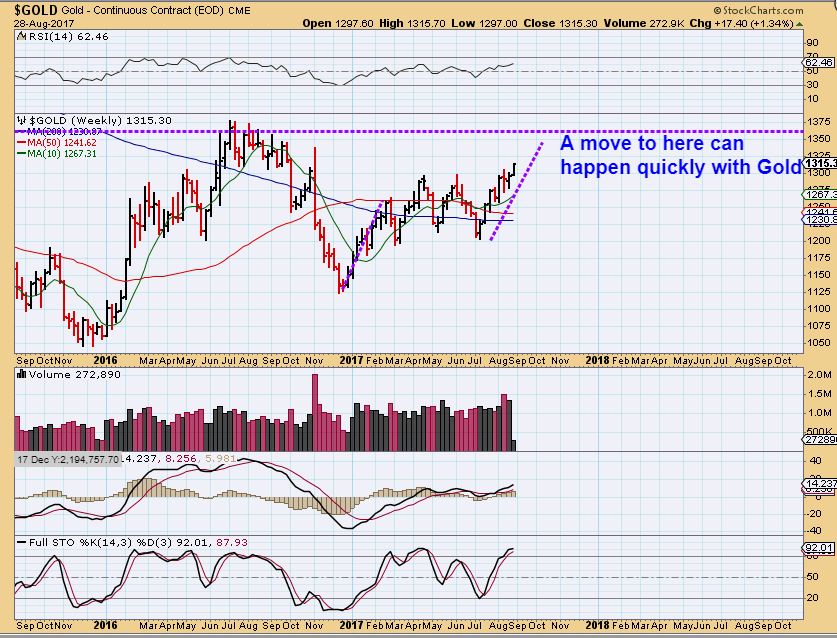
GOLD WEEKLY– On August 28 Gold was breaking above 1300. Gold could move quickly to the area of the former highs, so I had roughly 1360-1375 in mind, where congestion at the highs formed in 2016. This is where I would expect price could stall.
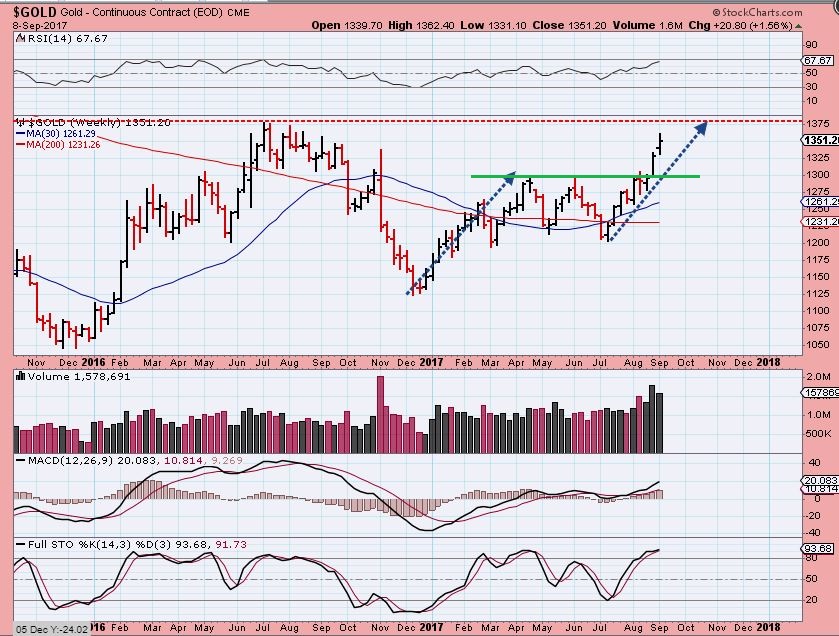
GOLD WEEKLY– As of Friday, Gold has been moving right along. I do think that it could go a bit higher, but we may be nearing that temporary peak. I finally sold my Leverage Friday, and mentioned it in the live chat area, but I still own my individual Miners in case of any upside surprise.
GOLD DAILY – I have been saying all along that this could top in the early 20’s of the daily cycle count, so this topping candle was a good enough place for me to let go of my leverage, even if we do have a run away move or melt up from here.
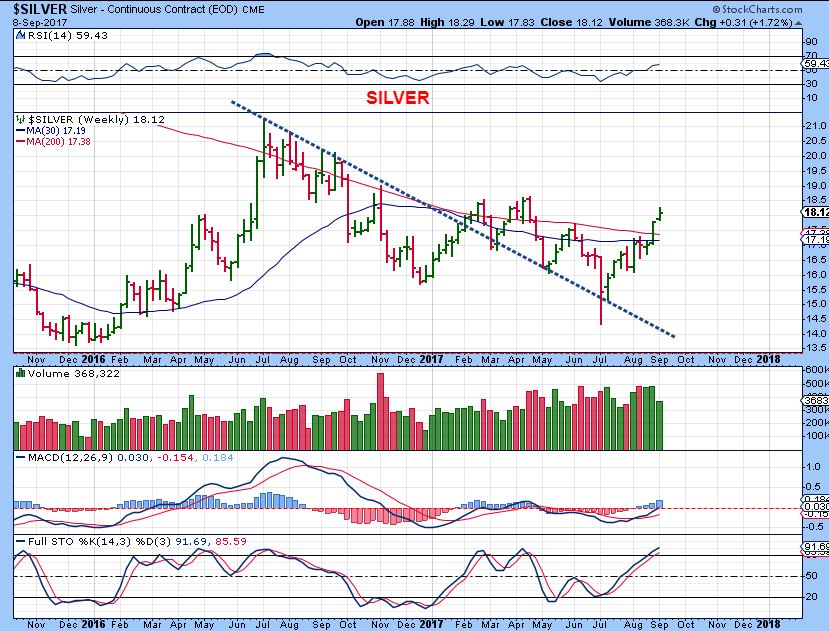
SILVER- A weekly chart where Silver is above important Moving Averages.
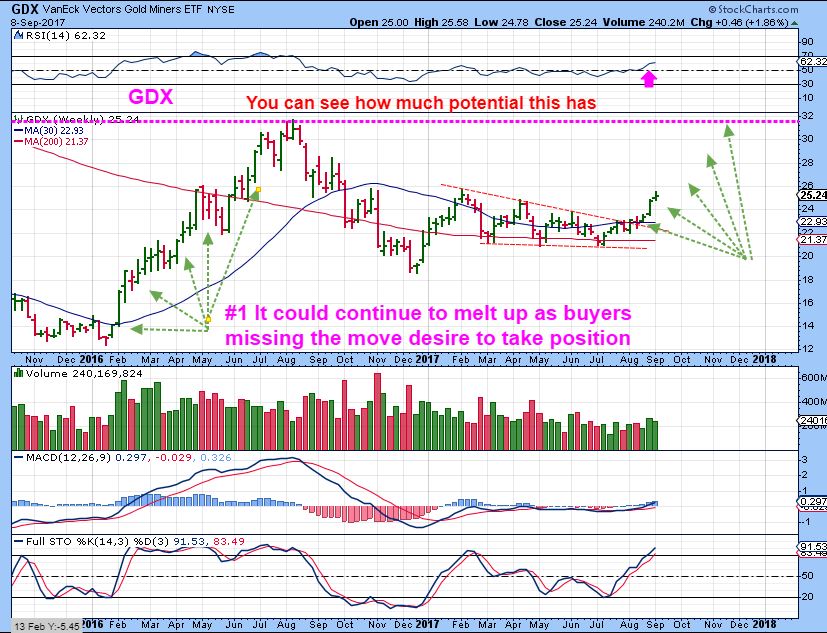
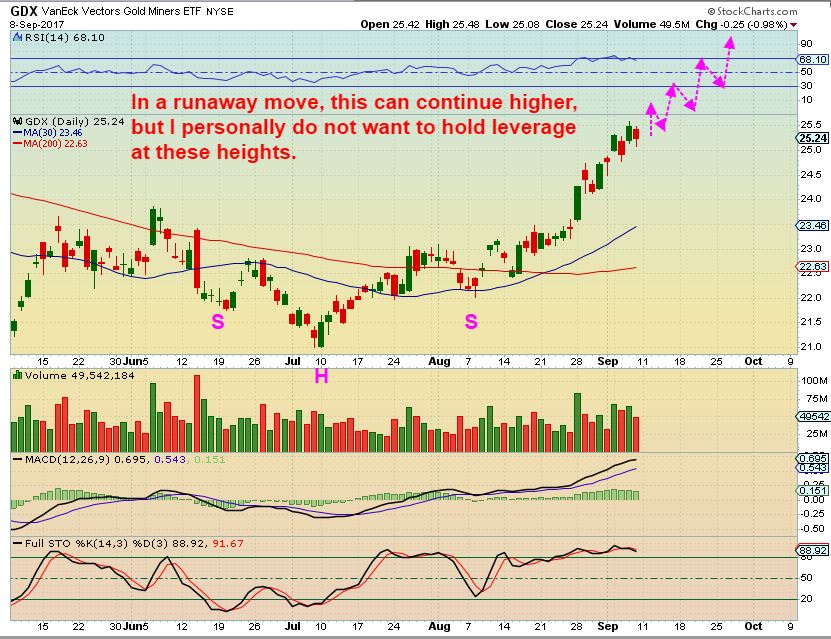
GDX- If GDX runs to former highs (and I believe that it will over time) the potential is great.
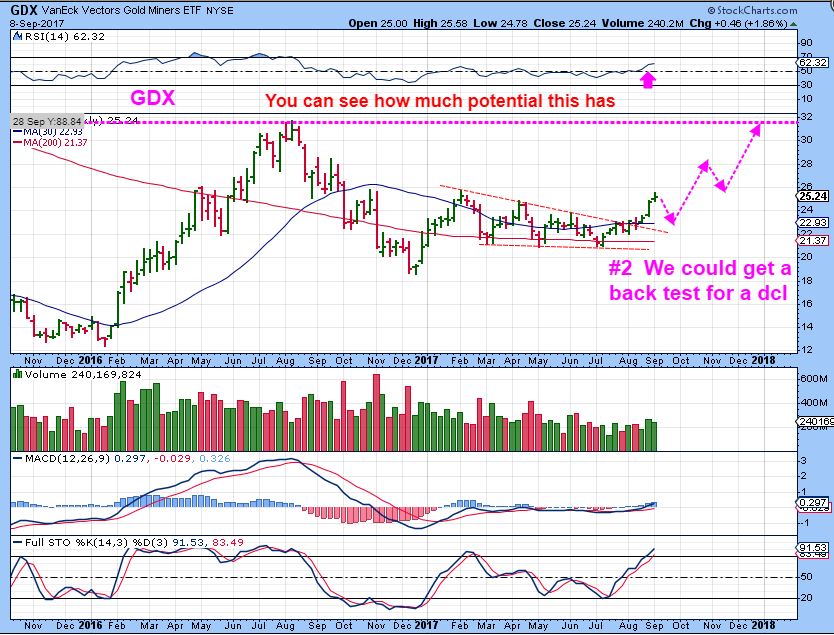
GDX- A triangle break out that we were expecting could stall here. A back test and stair-step higher is possible too, but…
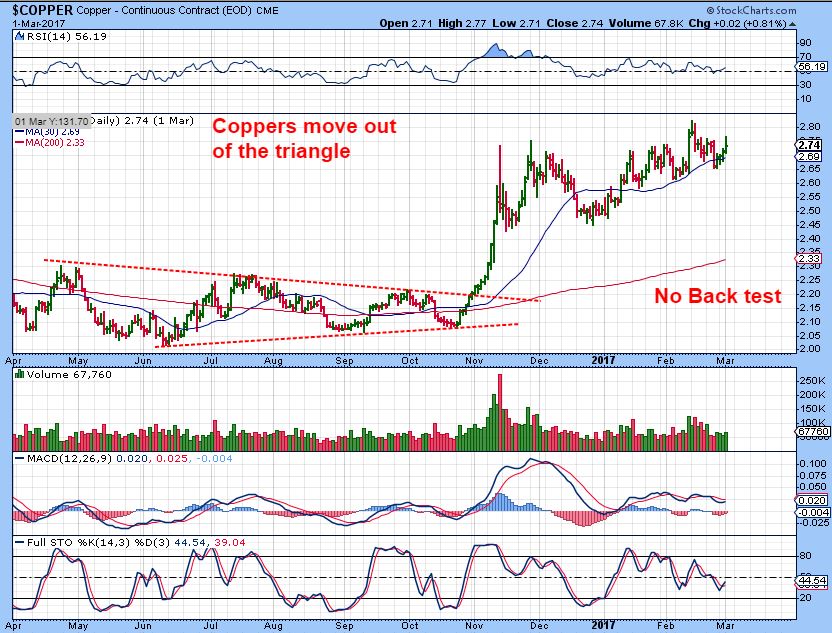
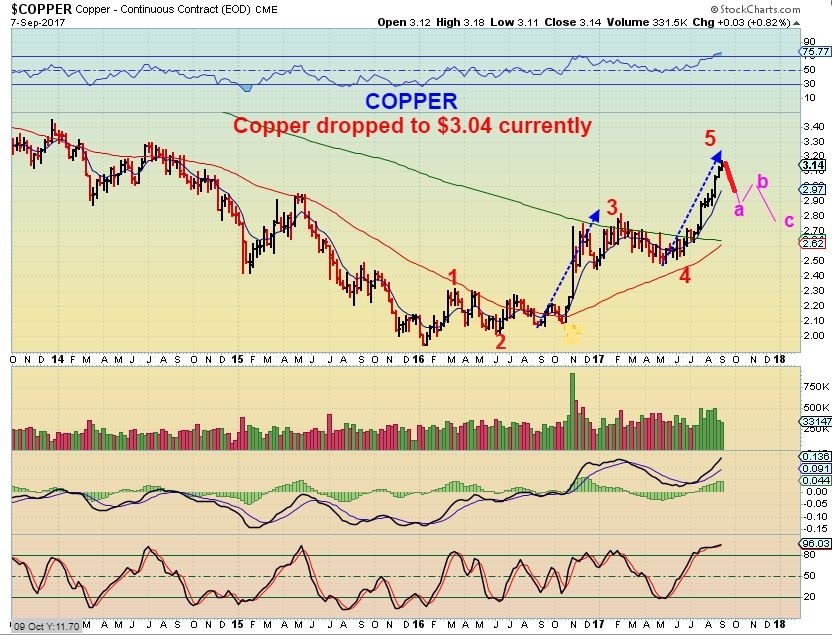
Example from COPPER- I wanted you to see that with a Triangles break, they often are fueled by short covering, smart buyers, and then the chasers taking positions that missed the move out of the lows. Copper is an example of a ‘melt up’ or ‘runaway move’ out of a triangle break out. Notice that there was NO BACK TEST. So I am watching Miners closely going forward.
Something else to take note of:
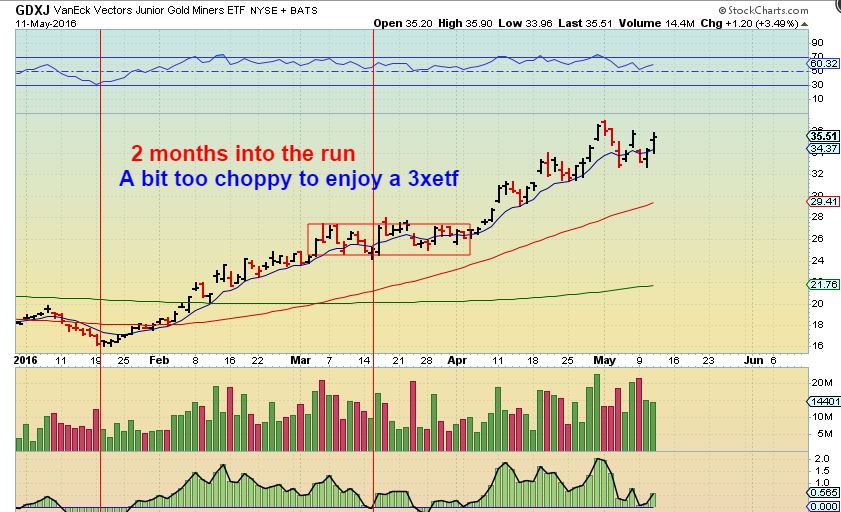
This year Golds ICL ( DEEP MEANINGFUL LOW) came about in July 2017, so GDX/GDXJ has been moving off of the lows for 2 months. In the strong run out of the Jan 2016 lows, Miners paused after 2 months as seen in GDXJ below. There was NOT a huge pull back, but price stalled and went sideways for a month.
THIS IS GDXJ 2016 – That said, we could be due for a pullback or maybe just a sideways move. This is why I sold my leverage. A 3x ETF is difficult to ride in choppy sideways consolidations or pull backs.
So currently we are at the 2 month point of this run too. GDX/GDXJ could have a
1. normal pull back,
2. it could go sideways for a bit,
3. or it could continue to melt higher. That is why I cut leverage, but am holding some miners.
#1 Example of a possible run away type move ( Why I still hold individual Miners)
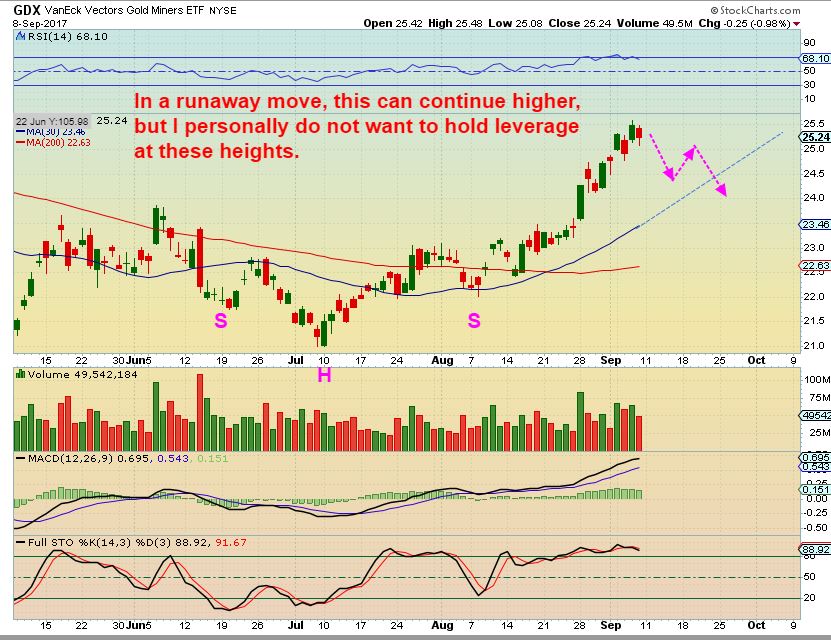
#2 If it does pull back however, I do not want to hold leverage. This is why I finally sold my JNUG.
EDIT: I ended the weekend report with a summary of the markets sectors and this final comment below.
I wanted to give my usual sign off – ” I hope everyone had a restful weekend”, but I know that I have readers located in Florida, and I also have readers in Houston Texas, both enduring the results of natural disasters. Mexico had an earthquake this weekend, Asia is being threatened by Typhoons too, and honestly, many are dealing with anxieties, enduring unforeseen hardships, etc, globally, not just locally. My thoughts and well wishes are with the many going through hard times and enduring trials at this time.
For the public readers – If you think that this kind of analysis can assist you with your trading by adding it to your style of trading, along with daily reports that may include some stock picks as a low risk entry point, why not join and try us out for a month or a quarter? Thanks for checking out Chartfreak. 🙂
Chart Freak Premium
Chart Freak members receive up to 5 premium reports per week covering a wide array of markets. Come and join the ChartFreak community as we trade the new Gold Bull Market and various trending sectors.
TO SIGN UP _ CLICK HERE
~ALEX
2 Current trade updates:
HOS #1 – Hos popped and dropped on Friday, after I mentioned that I liked this set up. I actually still like the set up. The whole time that HOS was climbing during August, the XLE & OIH was dropping rapidly.
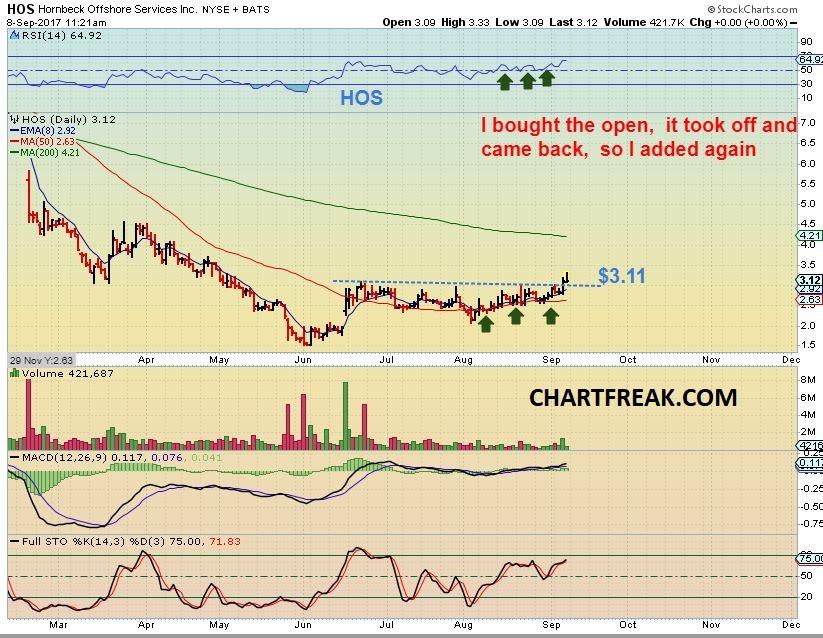
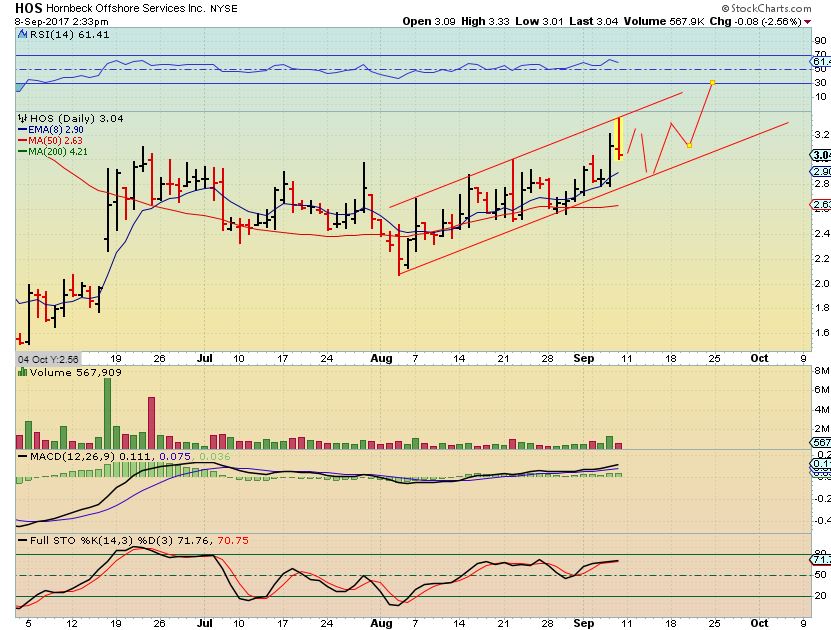
HOS #2 – So this channel developed as the XLE & OIH were selling off sharply in August. Fridays reversal could just be price holding to this channel, I still like this trade.
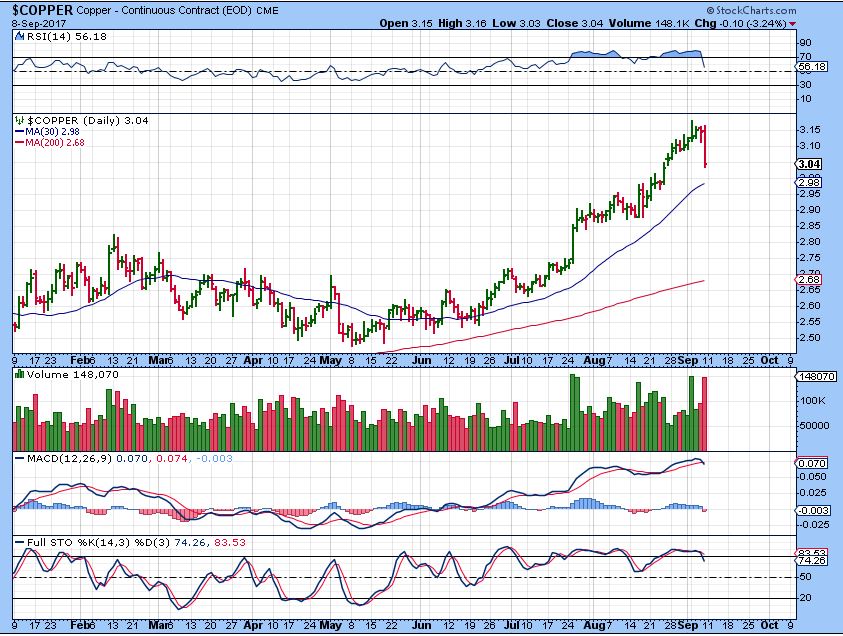
COPPER too a sharp drop Friday too, after a nice long multi week ( month) run higher out of it’s base.
I drew this on Friday as a possible 1-2-3-4-5 complete, showing that copper could be starting a short pullback. TGB sold off and actually partially recovered, but I sold my TGB & locked in gains for now. I did NOT sell my WRN, but it also had a sharp drop, so anyone that dumped it- that would be understandable. Lets discuss WRN.
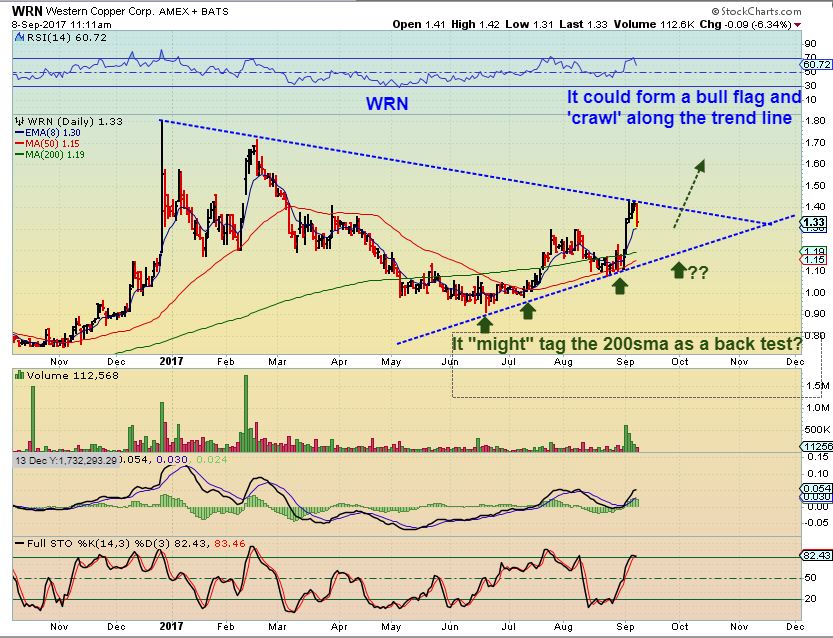
WRN #1 – As a result of Coppers drop, WRN also took a sharp dive off of the highs. This raised questions about the possible path going forward. I’m thinking that the selling in Copper slows down, and I think that WRN could bull flag and still eventually break out, crawling along this trend line.
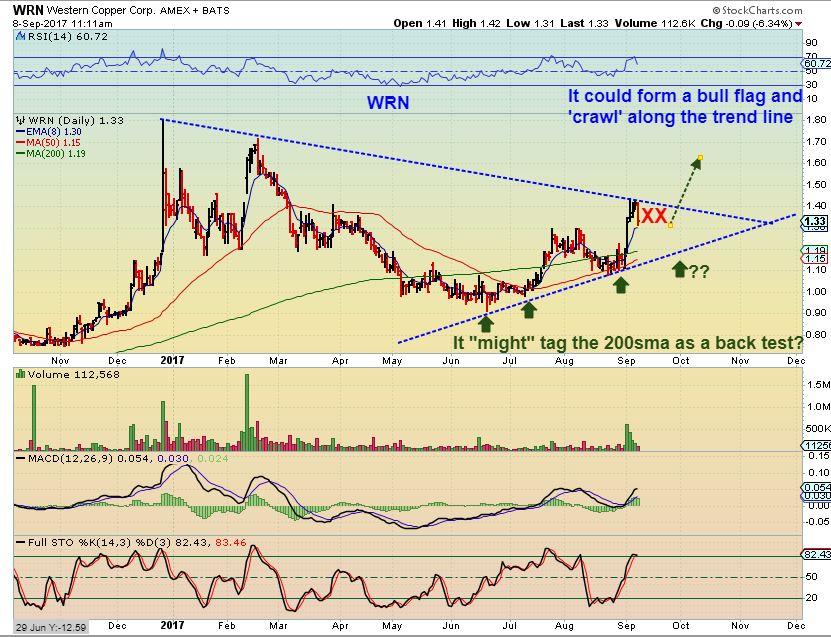
WRN#2 – The bull flag formation could look like this, Or price could drop & tag that 200sma or even the 50sma again.
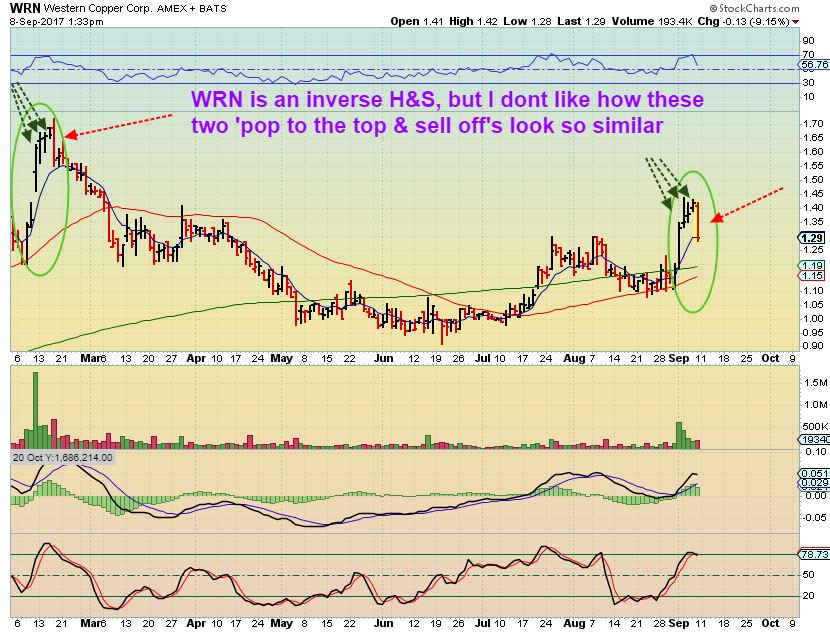
WRN #3 – I thought about a deeper drop to ‘back test’ the 200sma as being possible, when I noticed how similar the price action was inside the green circles in this chart. This could drop to the 200sma too.
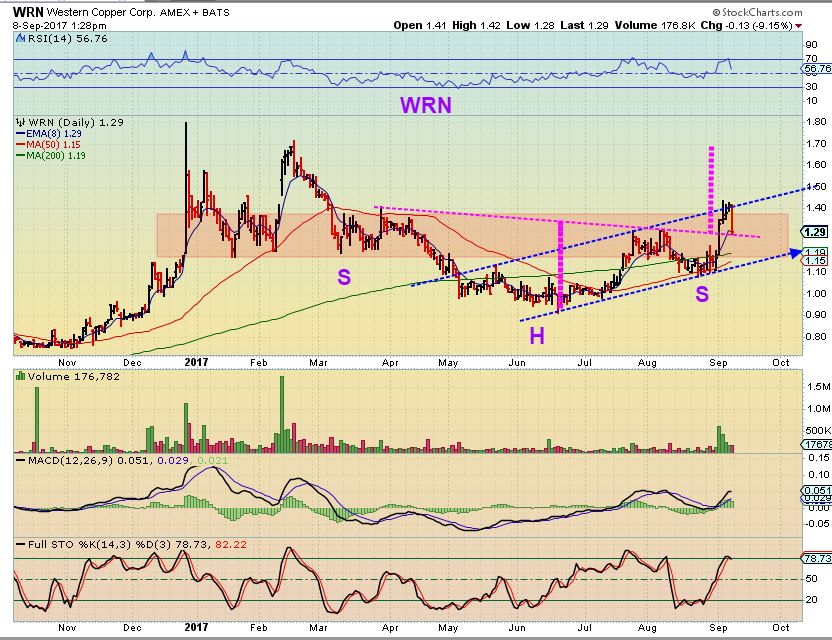
WRN #4 – I bought my position in WRN as it crawled along the 50sma down near $1.10-$1.15- so I am holding on for now. I still like the big picture set up, and want to see how this plays out. It should remain bullish unless something bad happens to Copper itself.
Sept 10 – Is It A Melt Up? 
 Sept 12th
Scroll to top

I´m going to head out to the gym and let this play out however it wants. So far, I only got fills on MUX buy orders today, others still out there waiting. Will check on things later.
SINO is starting to pick up. Been holding this for a cpl weeks now and finally in the green
dammit.. that mofo stopped me out on the 50 last week
Just came across a Lithium miner – SQM. Monster chart… Thoughts CF?
All the lithium stocks are ripping today
TRVN and TWTR looking really good today, breaking above their 50s.