
Did You Buy That Dip?
At Chartfreak, we were anticipating that a higher low in Oil would prove to be an exceptional buying opportunity after the recent summer sell off. Cycle timing was telling us that it was ‘time’ for a low to develop, so we began monitoring the charts using technical analysis and cycle timing. Did you buy that dip at the right time? Let me show you what we were watching using actual charts from our August reports. You can ask yourself, if I was a chartfreak member, would this may have helped me with my investing in this sector?
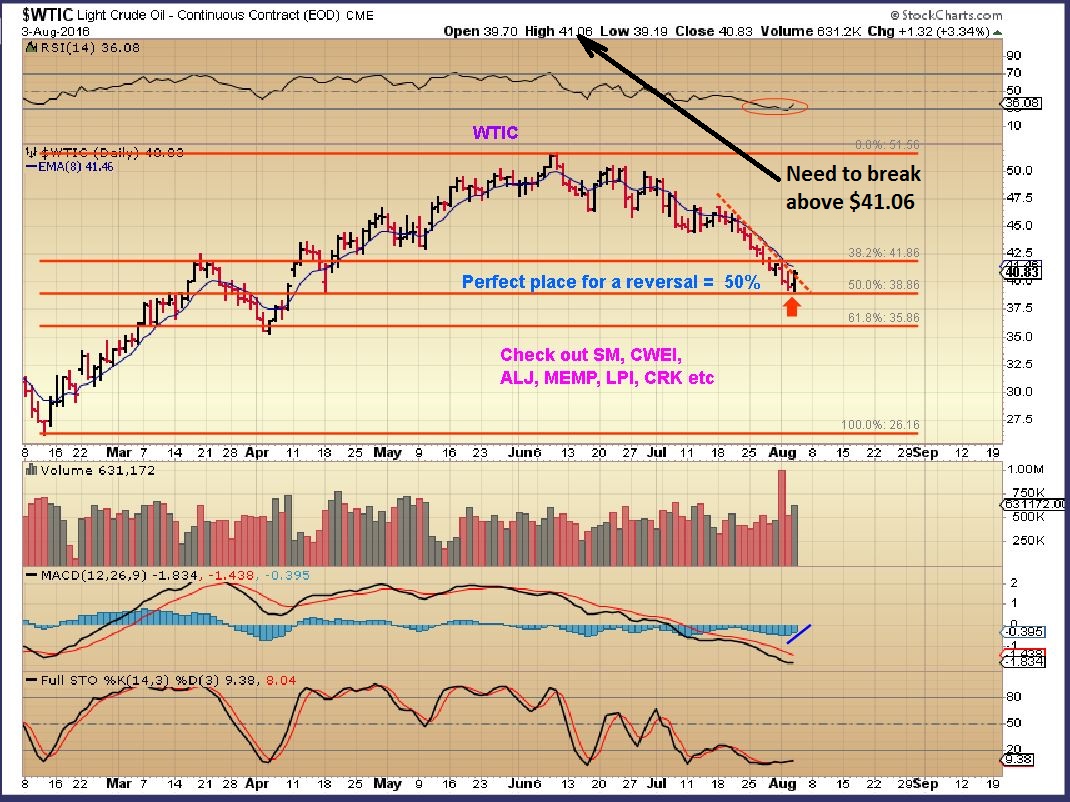
WTIC AUG 3 – Anticipating the coming low, I used this chart to start with. We had a 50% retrace and some Energy stocks were beginning to look Bullish too. I encouraged readers not to buy until we get a break above the tight downtrend.
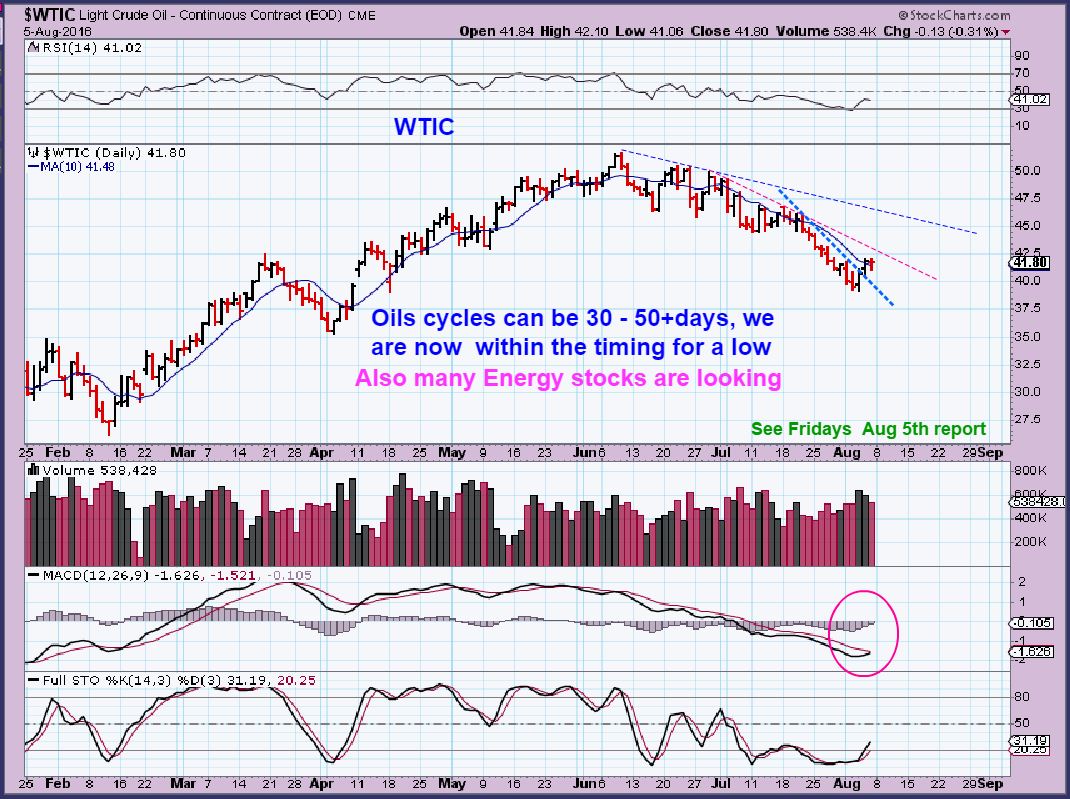
On Friday AUG 5th I posted a report with some Oil / Energy stocks that were set up to move higher. Oil was now acting correctly for putting in that higher long term low called an ICL in our Cycle work ( Intermediate Cycle low). These cycles are long cycles, so buying near the lows would be rewarding.
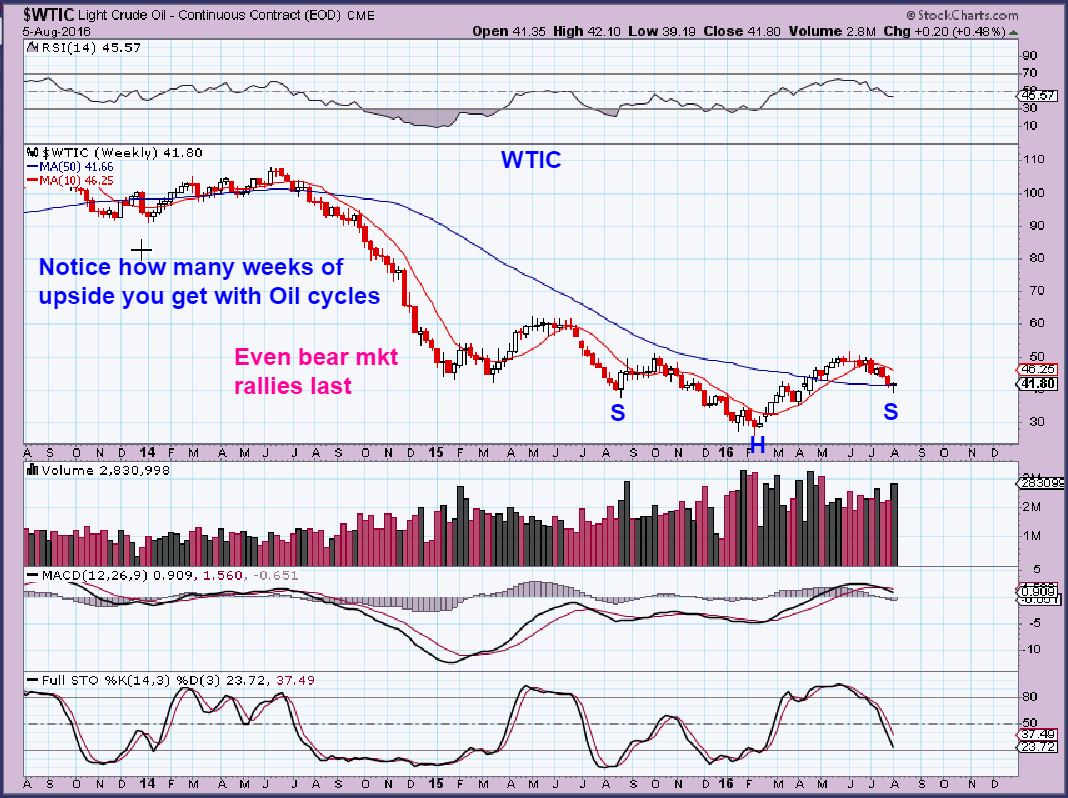
The weekly chart on August 5th showed the reversal- and I expected WEEKS of upside out of this inverse H&S.
IMPORTANT – If OIL DROPS AND TAGS THIS 10 SMA, DONT PANIC, BUY! 10 SMA was at $41.46
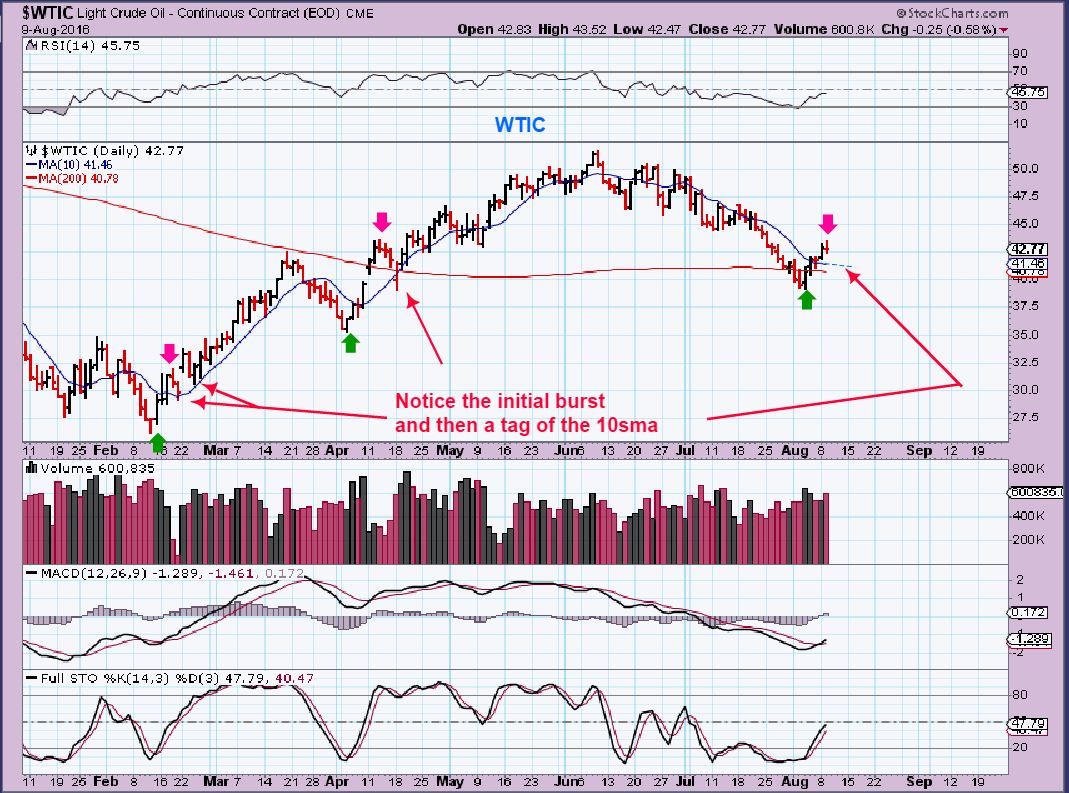
OIL DROPPED TO THAT 10 SMA. THAT WAS A BUYING OPPORTUNITY
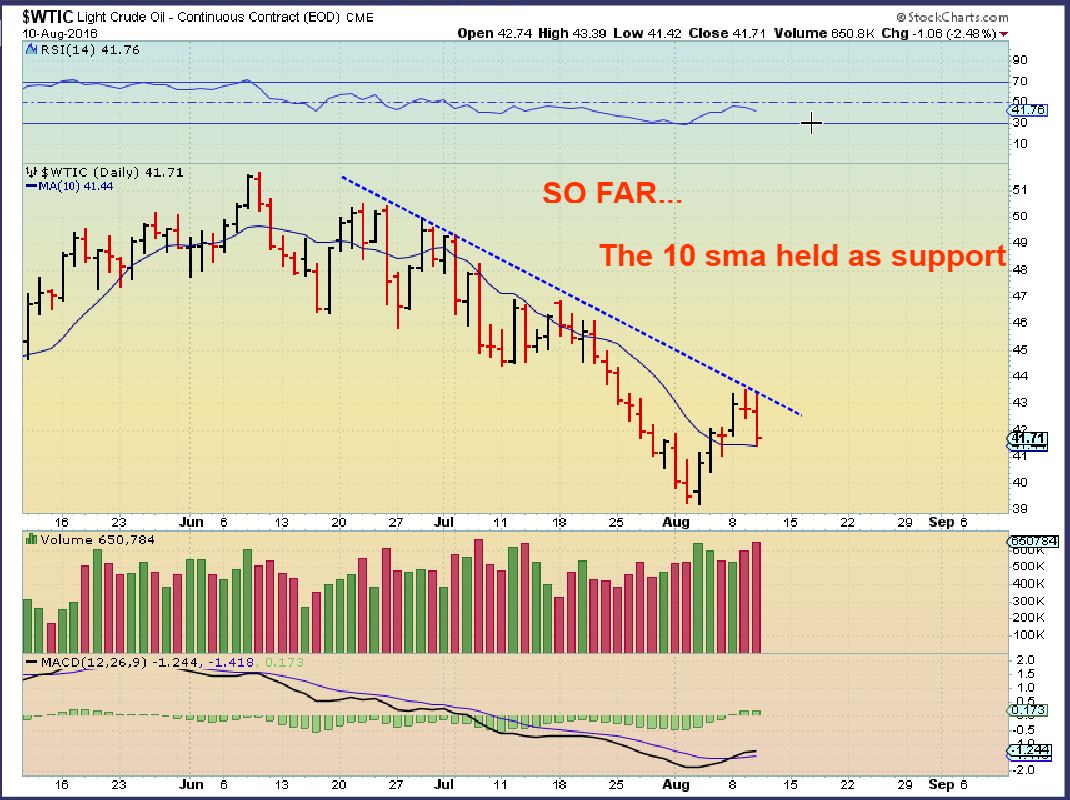
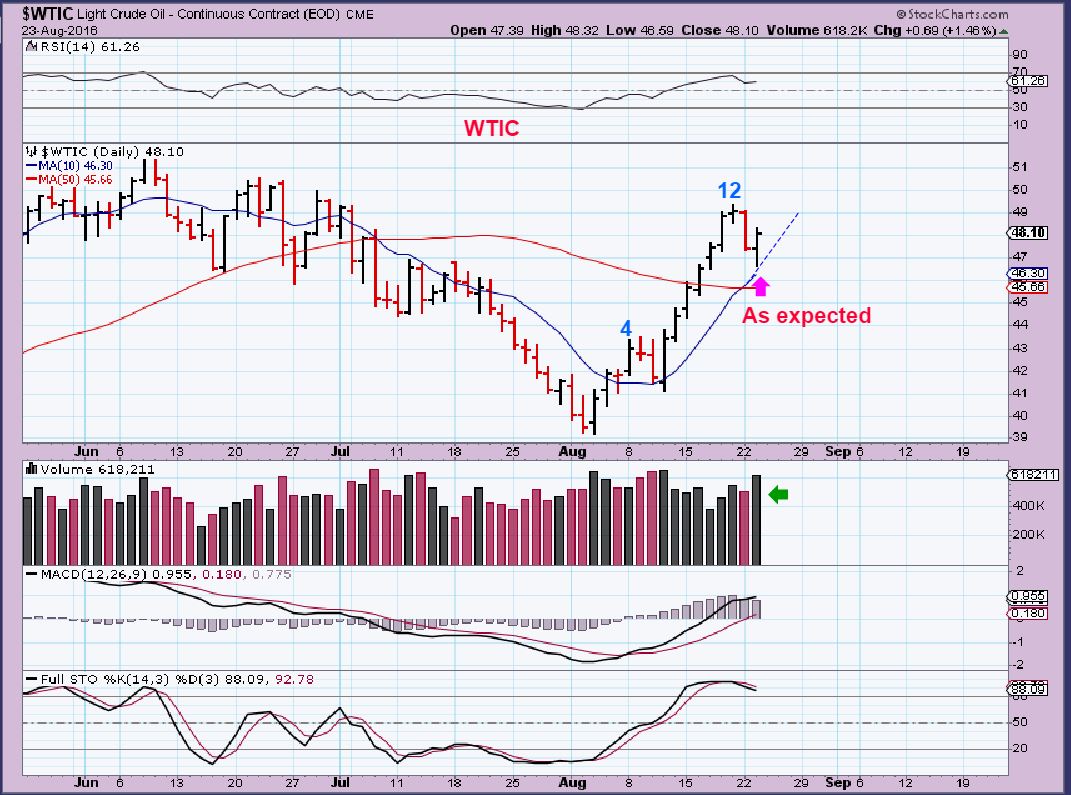
And the rest is history. You can see that that dip to the 10sma was not a reason to sell or panic, it was a reason to buy.
Look at the chart above again, and look at the sell off in Oil from June to Early August. Many were afraid to buy Oil and Oil company stocks, thinking that it would sell off back down to the $20’s and low $30’s. At Chartfreak, I was not only saying that looking for the next higher low would be the good buying opportunity that we were waiting for, but I was trying to build confidence by pointing out another important fact. I pointed out that there were actually OIL and Energy stocks that DID NOT sell off that much during that summer Oil sell off. Lets review what we were looking at.
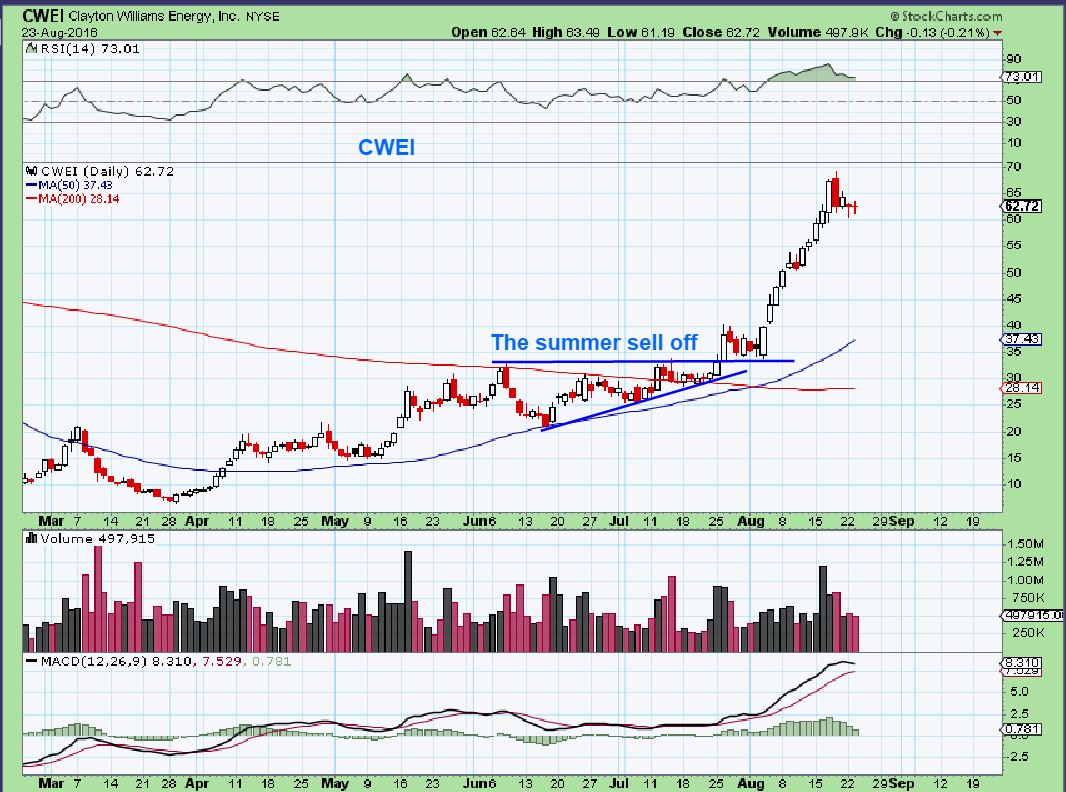
CWEI – An energy stock that we were trading / buying at $15- $18 in May. I called for a run to $30, and then a rn to $60 later. Did that one sell off this summer?
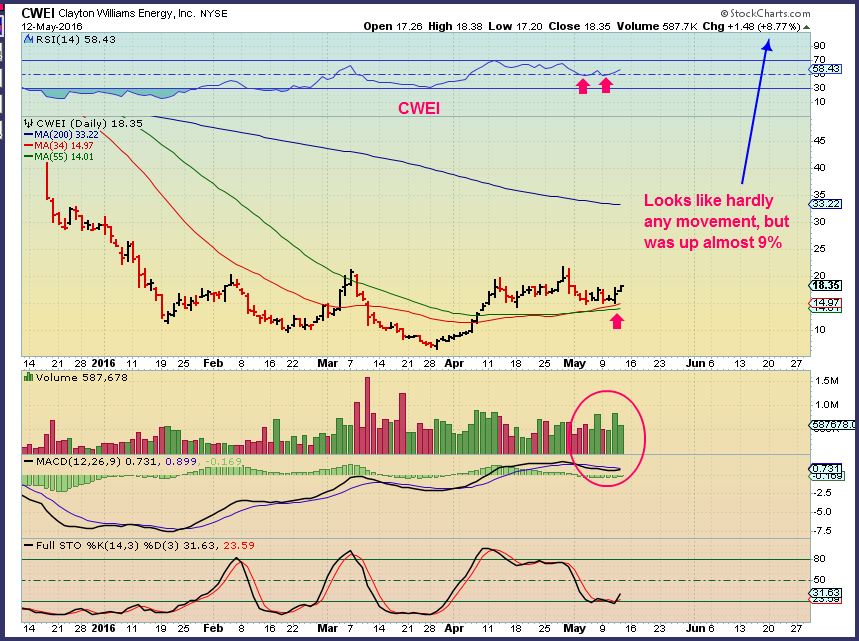
CWEI – I pointed out that CWEI didnt sell off during that oil sell off. I personally sold under $30 and didnt take this trade again, I was busy buying other stocks. Some readers emailed me that they did buy CWEI again, and it doubled in 2 weeks. Congrats to them for holding on to that great trade!
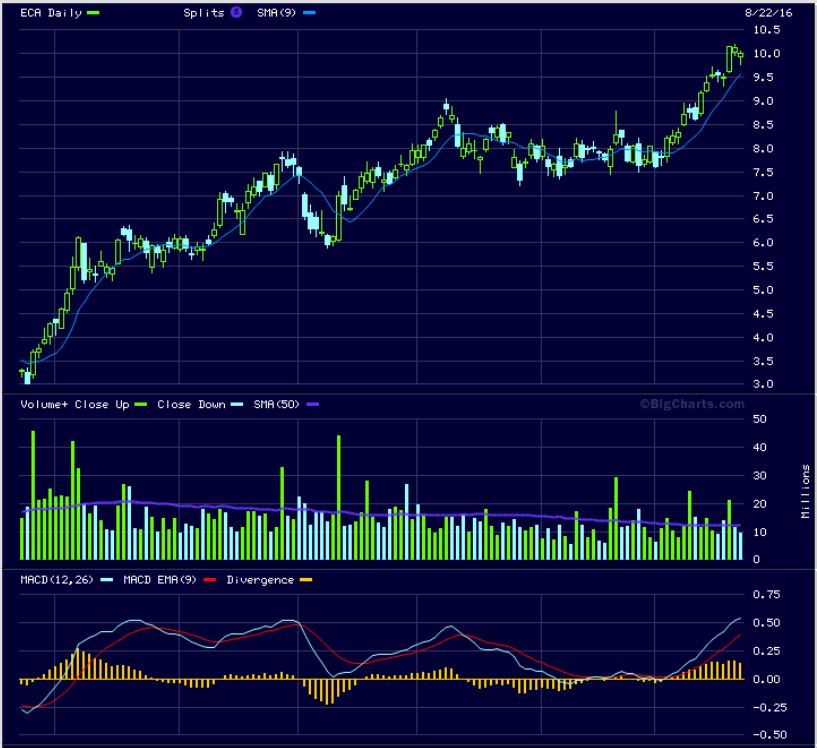
I also pointed out on Aug 18th that ECA ran from $2.99 to $9 and also didn’t sell off very much this summer. The upside potential is very good, and a measured target of $14 should easily be attainable as a 1st target. A run to $22 isn’t out of the question over time.
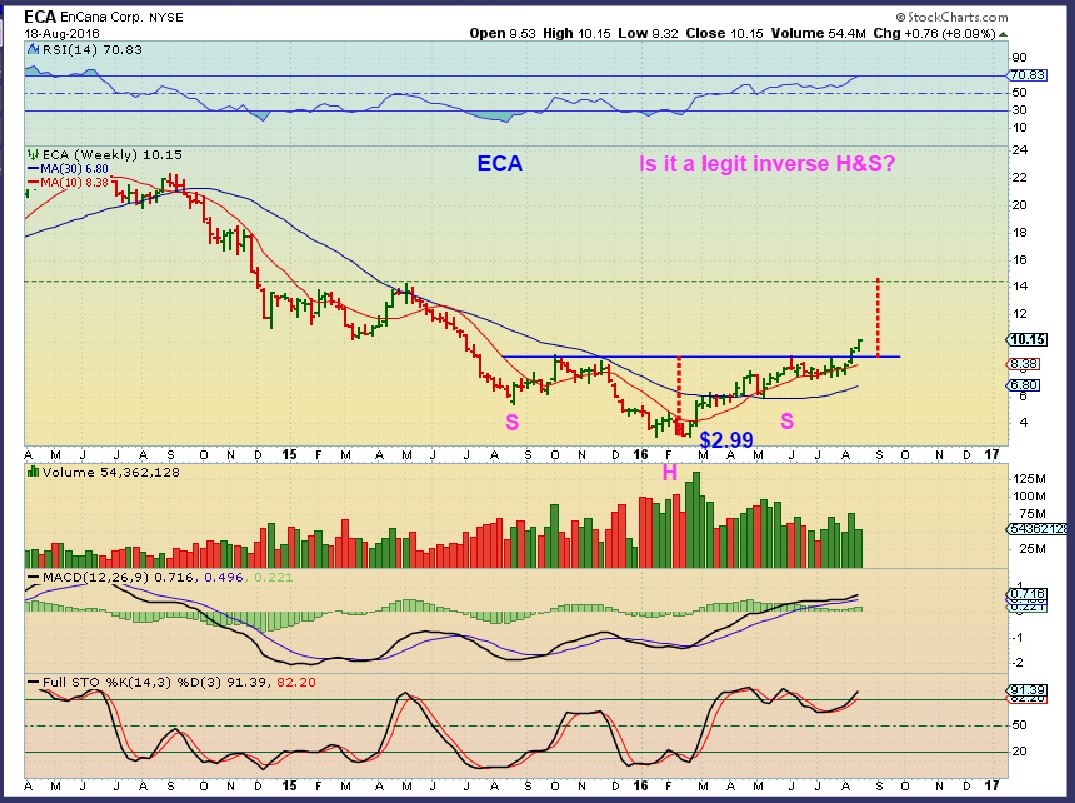
This chart of ECA shows that the Summer selling just caused a bullish sideways consolidation. This is still a good’ buy on the dips’ candidate today.
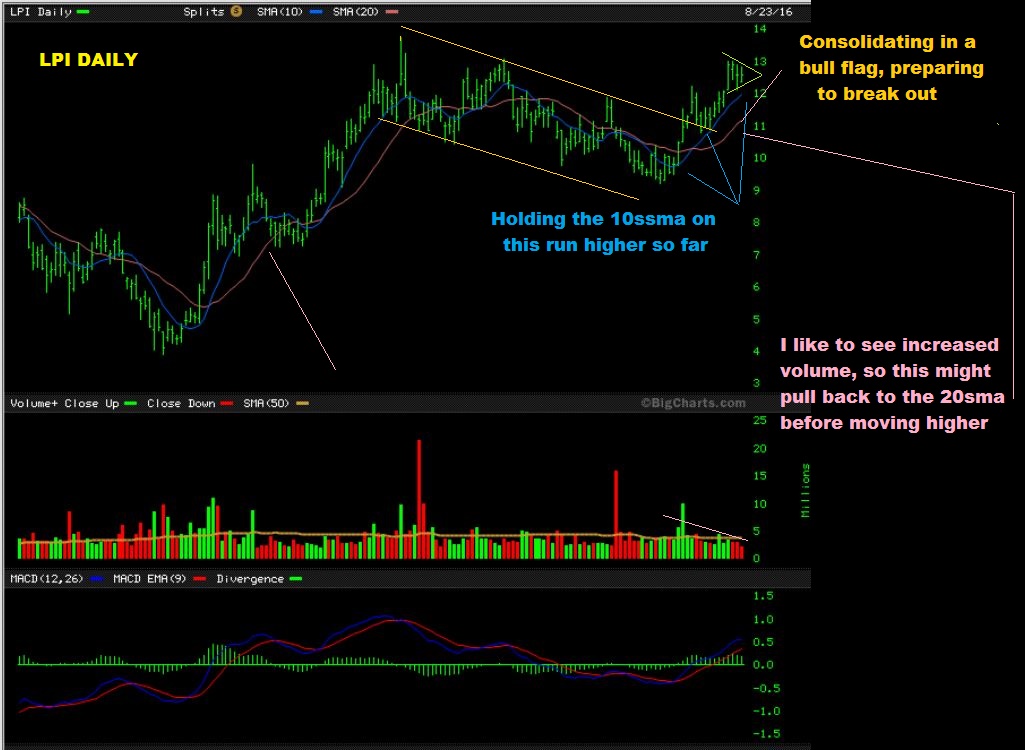
I liked that LPI ran from $4 to $14 in the initial run out of the lows. Using a daily chart I showed how it back tested the 200sma during Oils sell off, and then reversed higher. Here I used this weekly chart to show a nice Inverse H&S. It was a Buy from $9.50 – $10 with a stop below support ( or below $9).
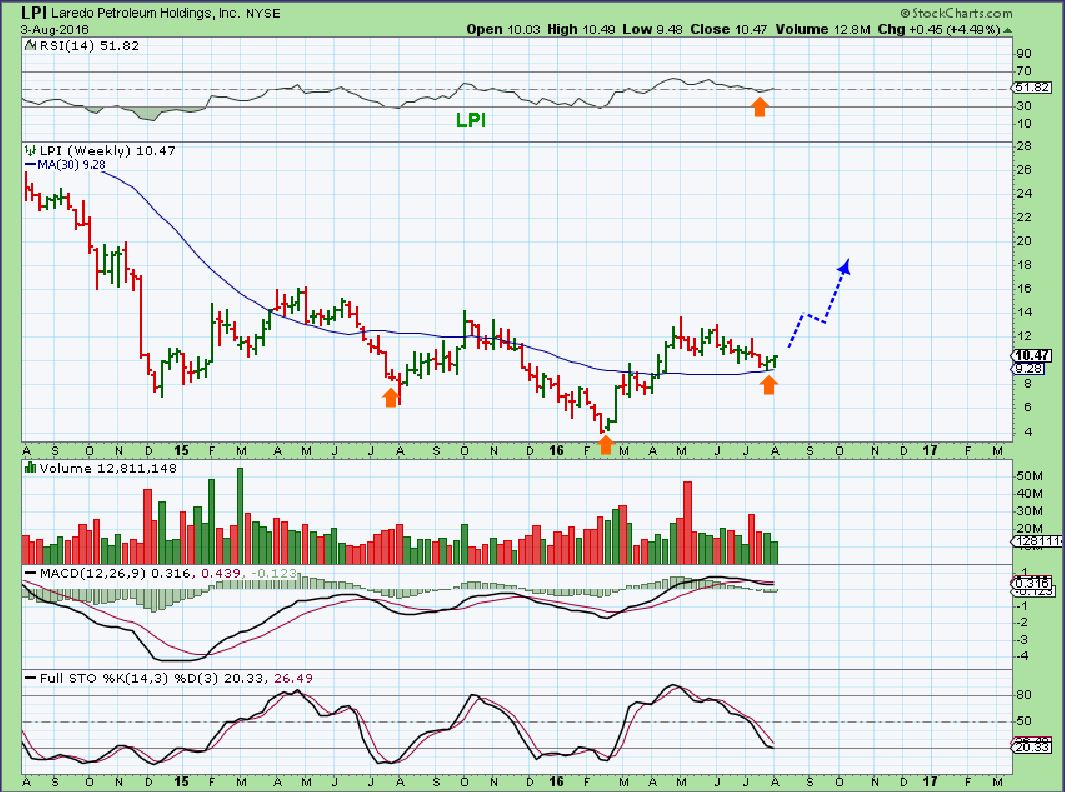
LPI – LPI has moved to $13 from the recent lows near $9, but I think that it continues to be a ‘buy the dip’ candidate. This is a bullish set up, now back near the 2016 highs. I expect a break out in the near future.
That’s just an idea of a few of the ways we at Chartfreak have been viewing the summer sell off in Oil, and some of the stocks that continue to set up as Buy the dips and add to current positions . In 2016 we have been very nicely rewarded by catching the lows in, and trading the Precious Metals sector and the Oil & Energy sector ( among others).
If you think that this type of technical analysis, cycle timing, and reporting could help you with your investing, why not give us a try?
Thanks for reading along at Chartfreak!
Chart Freak Premium
Chart Freak members receive up to 5 premium reports per week covering a wide array of markets, as this public post illustrates. Come and join the ChartFreak community as we trade the new Gold Bull Market and various trending sectors.

~ALEX
.

