Archive for month: April, 2016
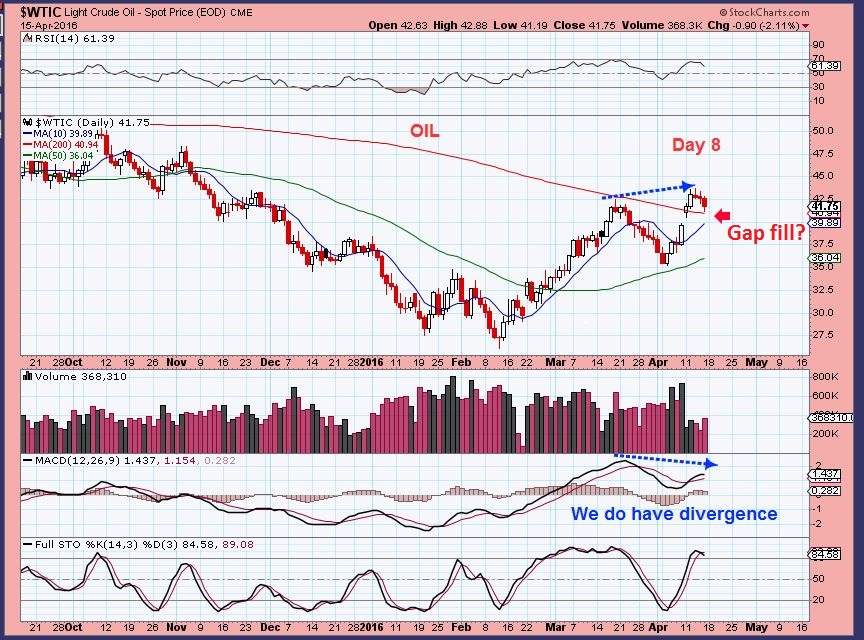
Energy Sector Review – It’s all a matter of perspective. If you fell asleep Sunday night and didn’t wake up until after the market closed on Monday, you may have thought that not a lot had happened. If, however, you read my report Monday morning , you saw that Oil had dropped 4% overnight. CNBC and many other sources of information where lit up. Was ‘Oil dropping to the 20’s again’? Was it ‘a great time to go short’? No, Cycle timing and the charts were pointing to possibly just a small pull back. We are invested in Oil & Energy, so this was important. This was our Oil chart in the report.
.
WTIC – Oil was early in the 2nd daily cycle, and the first one was Right Translated. So I expected more than just a day 6th high in this run.
WTIC MONDAY – Many ( Not here at Chartfreak) likely jumped in on the short side pre-market, but the shorts got overwhelmed. This reversal did fill the gap and it did something else too…
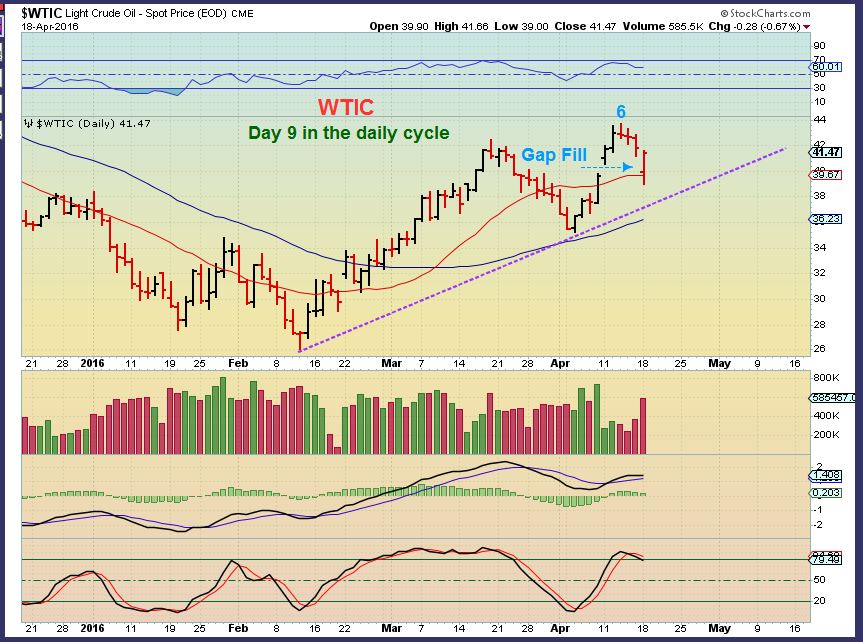
Notice this important observation
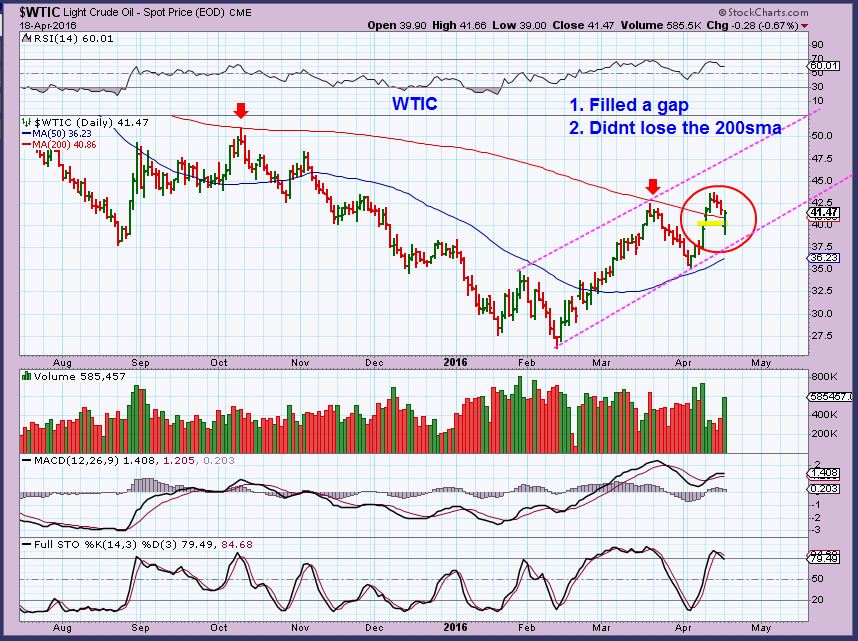
WTIC – Oil had recaptured the 200sma for the first time in over a year after repeatedly being rejected. It also CLOSED over the 200sma for 5 straight days!
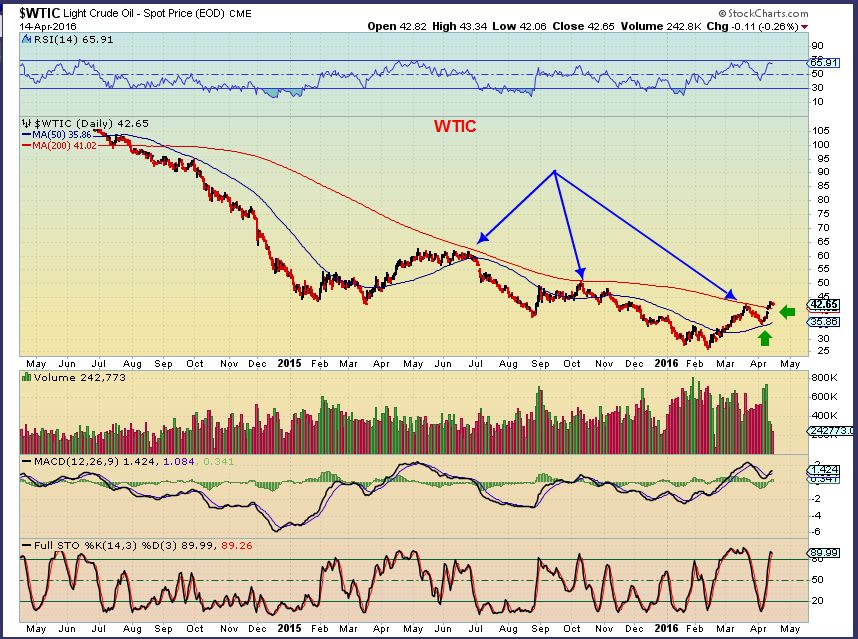
Today when Oil dropped and filled that gap, it actually also got back over the 200sma by the close. I felt that Oil ‘Could’ drop to the 50sma and still be fine, but holding that 200sma for 6 straight closes is impressive in my opinion. Oil remains bullish.
.
Oil reversed , but it still closed slightly down.
The XLE dropped right to the 20sma and reversed higher to close green. This also ‘could’ have dropped to the 50sma and lower channel, but it remained strong.
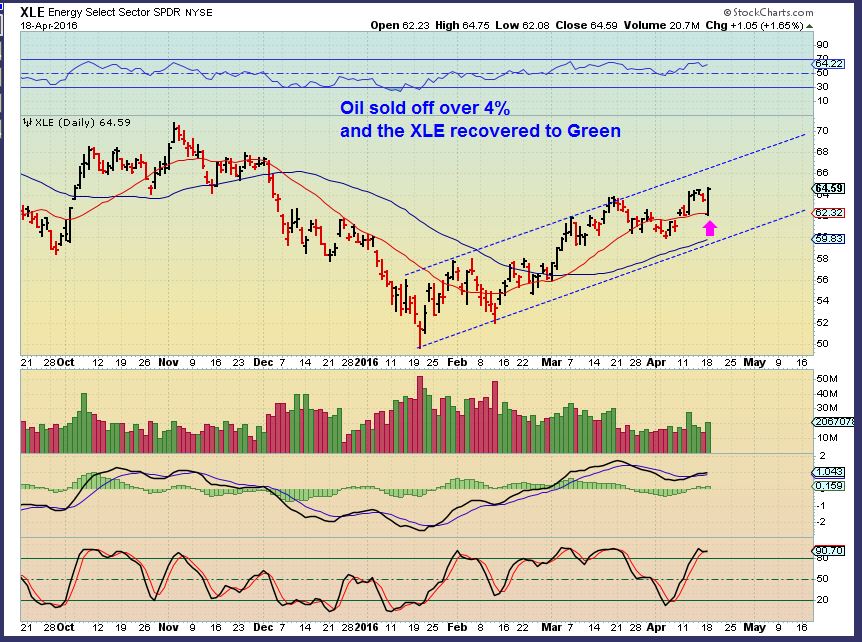
SO this was actually a bullish show of strength for Oil & Energy, I will discuss Energy a bit more at the end of the report. Lets review the markets.
ENERGY STOCKS
So the ENERGY STOCKS mentioned in last Fridays report ( And the Friday before) Still remain valid. They went on sale today, but most recovered. I did get some feedback that some readers here were buying. I also got feedback that after reading scary things in other trading forums Monday morning, a few sold at the open, basically at the lows of the day. Not knowing whether to buy the recovery as the day went on, I’m asked are they still bullish set ups or did the drop ruin things? Lets look at a few and see why they look and remain bullish to me. In some I’m going to go over the whole big picture for them – it may help.
.
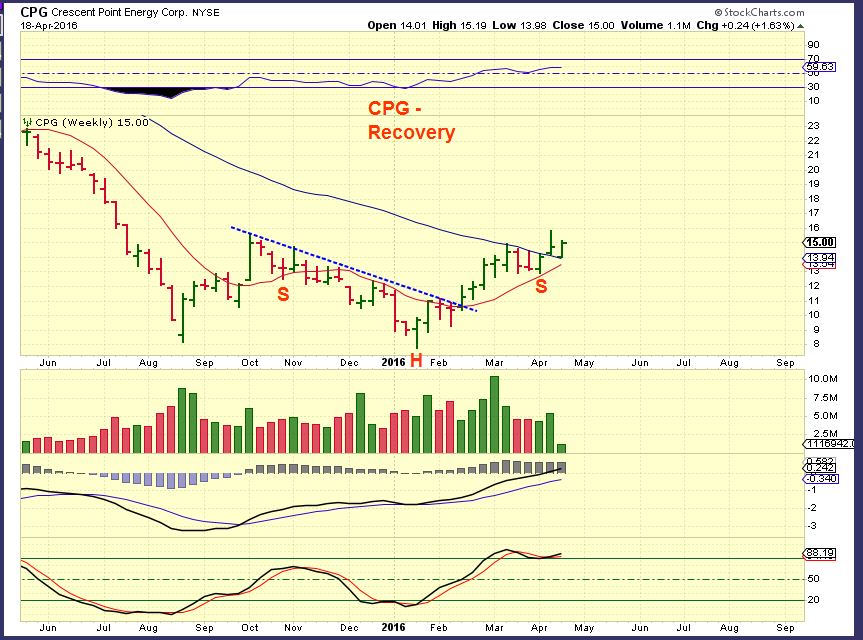
CPG – Breaking out from a long term trend line. It ran $7.50- $11.86 . I show this to show the progress that they are making since being mentioned in the report. This was at the end of Feb.
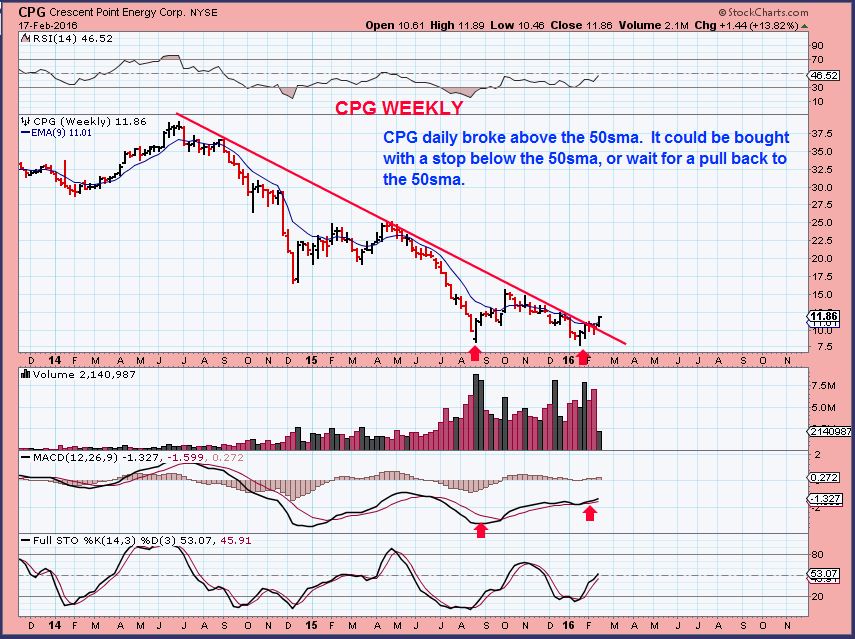
CPG WKLY – Now $15– It gapped down Monday morning to support, recovered and looks ready to run from an inverse H&S base. This also did not sell off when OIL sold off for 9 straight days.
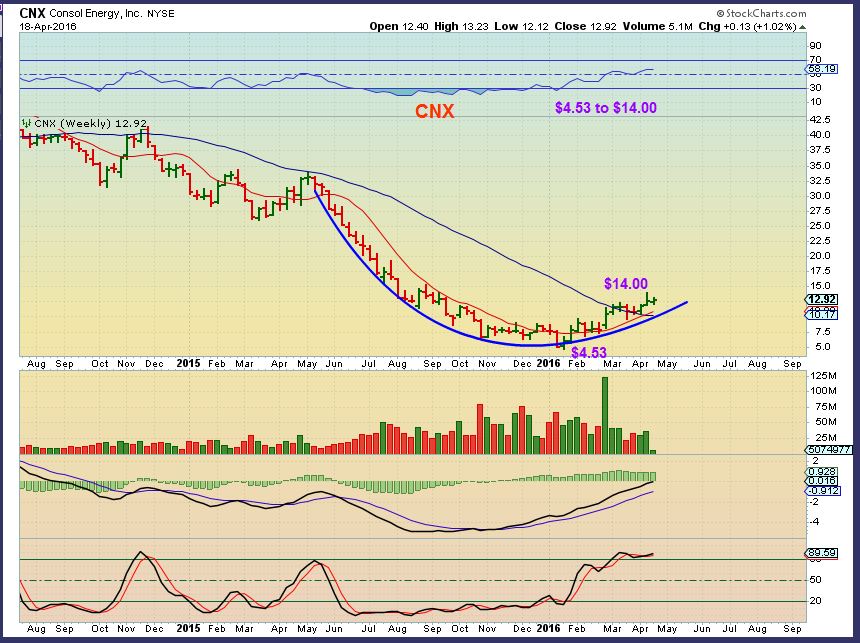
CNX- Breaking out from $4.53 to $8
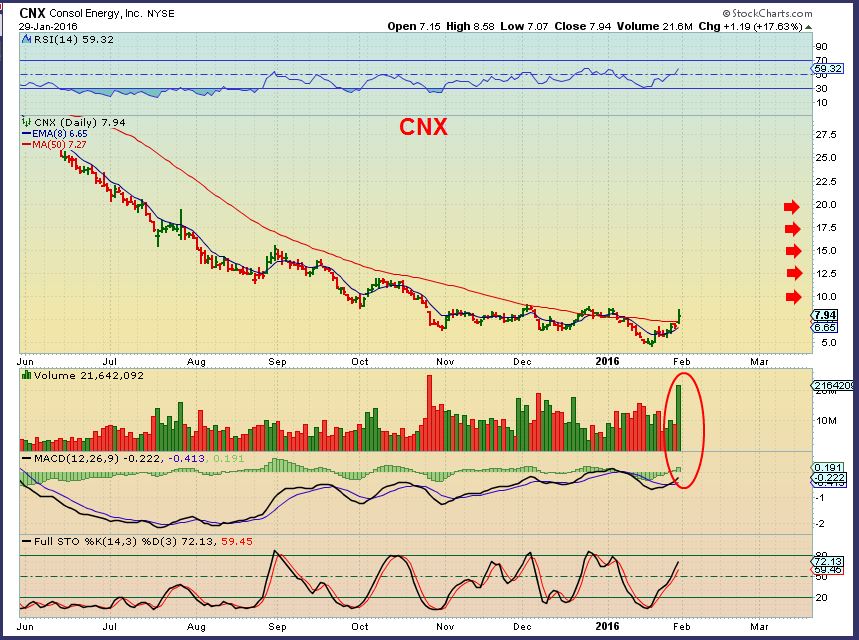
CNX WKLY NOW – When you look at a chart like this (weekly) it looks like we would say, ” I could have easily just Bought and hold that from $4.53 and tripled my money soon.” So I wanted to show you something very familiar to us now.
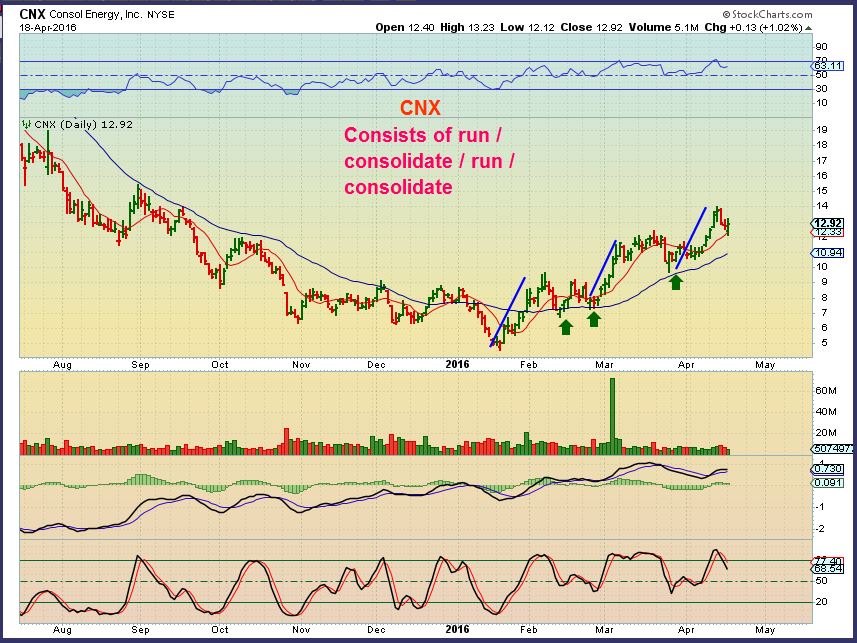
CNX DAILY – This was not just an easy ride. Patience in the consolidation phases was needed, sound familiar? I am showing you this to give you the visual of the day to day volatility in those consolidations. We rode consolidations in CLF, VALE, AKS, SID, and now AA. Also some energy stocks are jumping around and bucking us up & down, but longer term the recovery can be quite rewarding. Just use stops and remain alert. Look at the weekly chart above again 🙂
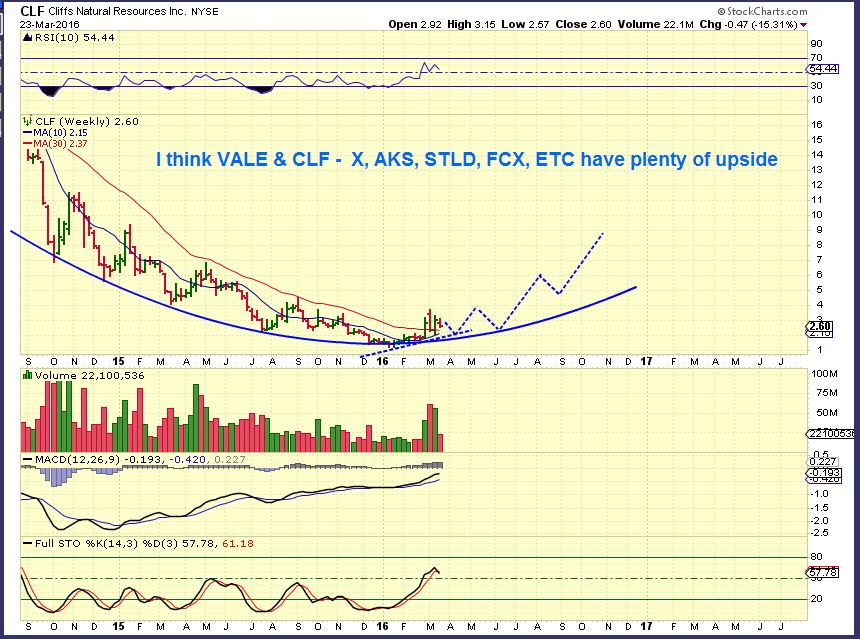
CLF – Do you recall this chart 1 month ago at $2.60? We probably all wish we could just go back, load up heavy, and ride out that consolidation phase knowing what we know now about CLF. It wouldn’t matter if it dropped 35 cents and then recovered, knowing what was ahead when it recovered.
.
SO again, ENERGY . Many stocks are recovering and OIL is early in the daily count for the 2nd daily cycle. Sometimes it takes a little sideways consolidation before the brek higher comes along.
.
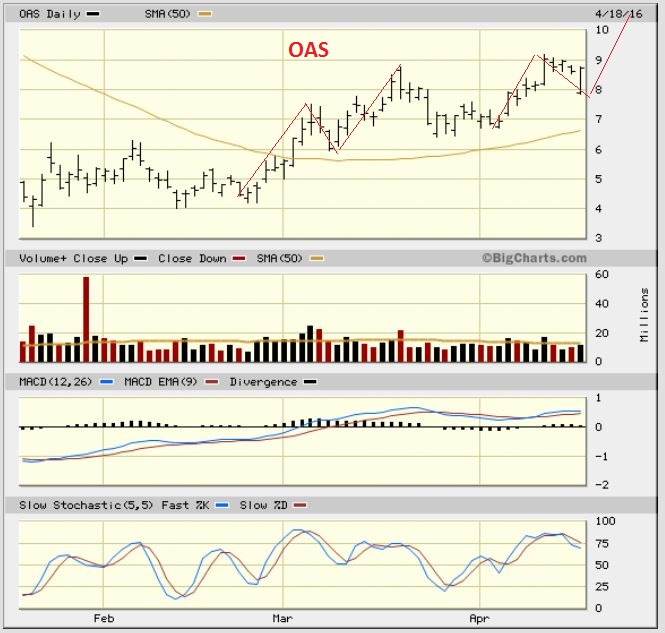
OAS – Roughly $4.20 to $9 since recommended. This chart was from the weekend report. Did it get crushed when OIL dropped 4% today?
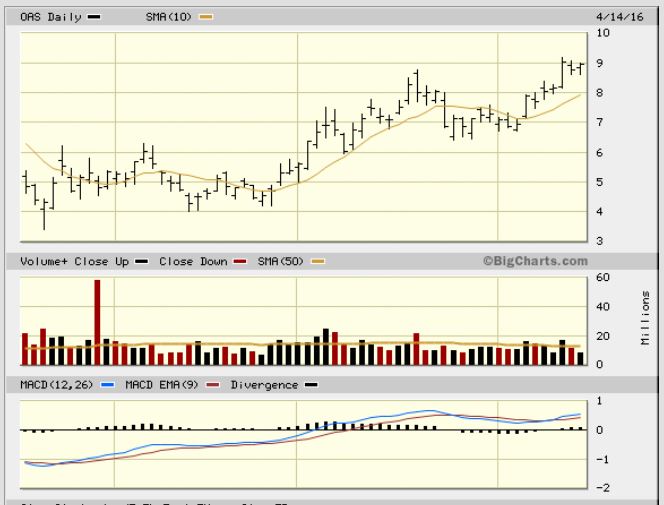
OAS – It did drop quite a bit, but it’s still a good looking set up. It went on sale today, but it would have been a scary buy until it moved a bit higher as the day went on. Even if someone didn’t buy it yet, it can still be bought here. Reminder: IT MIGHT continue to consolidate.
.
MRO– When first mentioned $14 was a resistance zone ( Keep that in mind).
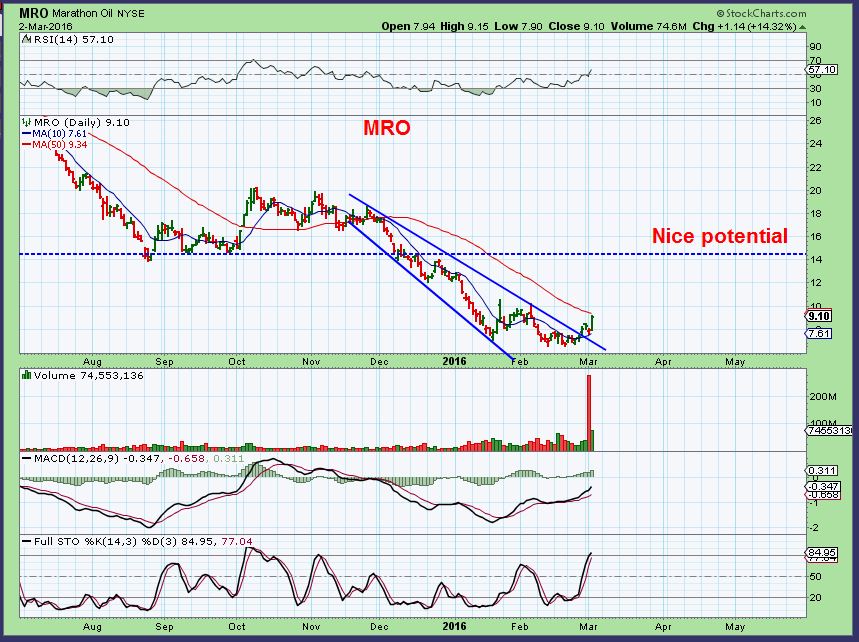
This was in last Fridays report, has anything changed?
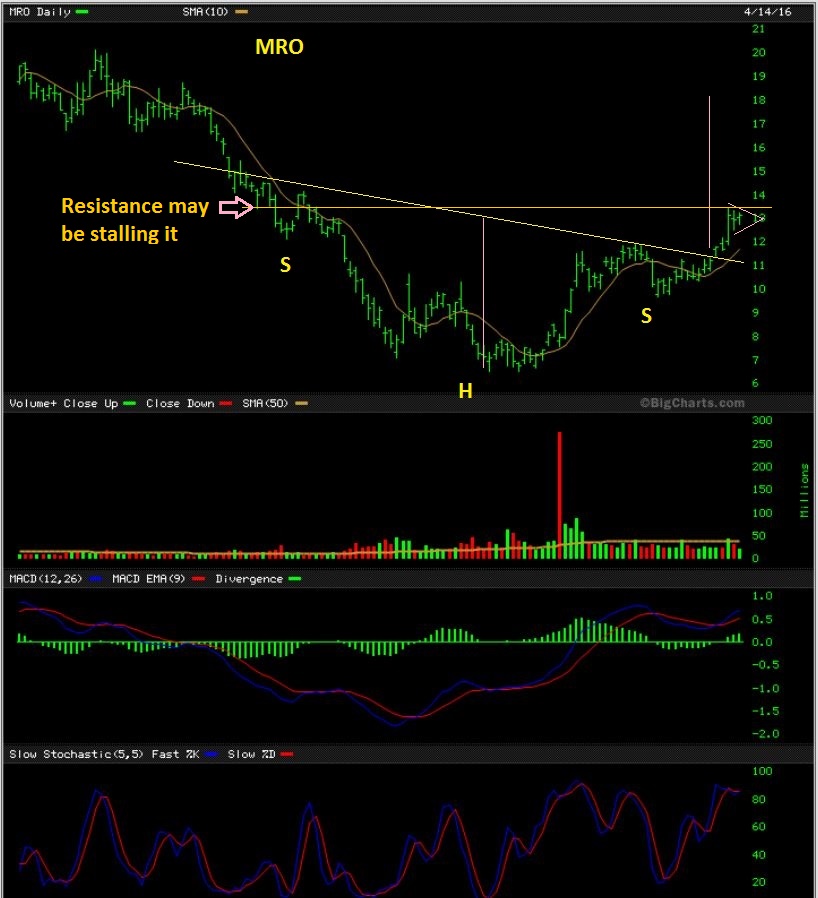
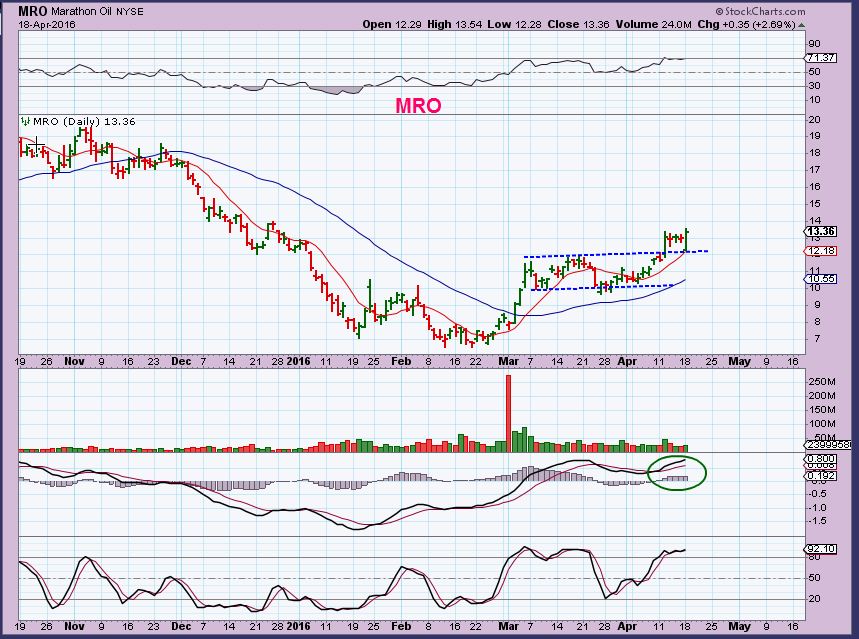
MRO Monday – Went on sale and recovered quickly. Volume was rather light, but that also means that it sold off on light volume when Oil was down 4%. Since resistance was at $14, it may be building energy to break higher.
.
ERF March 1st- Notice the measured move to $4.
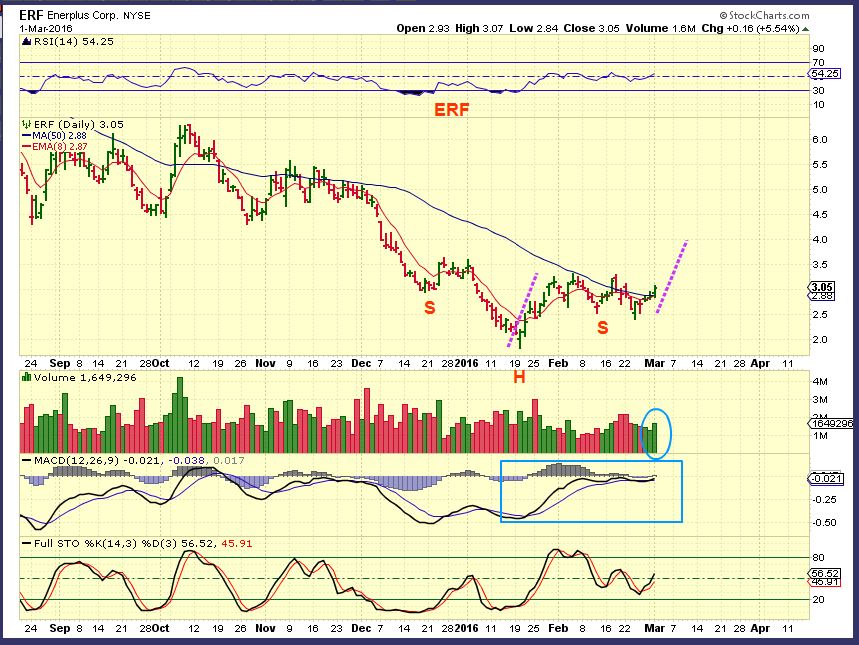
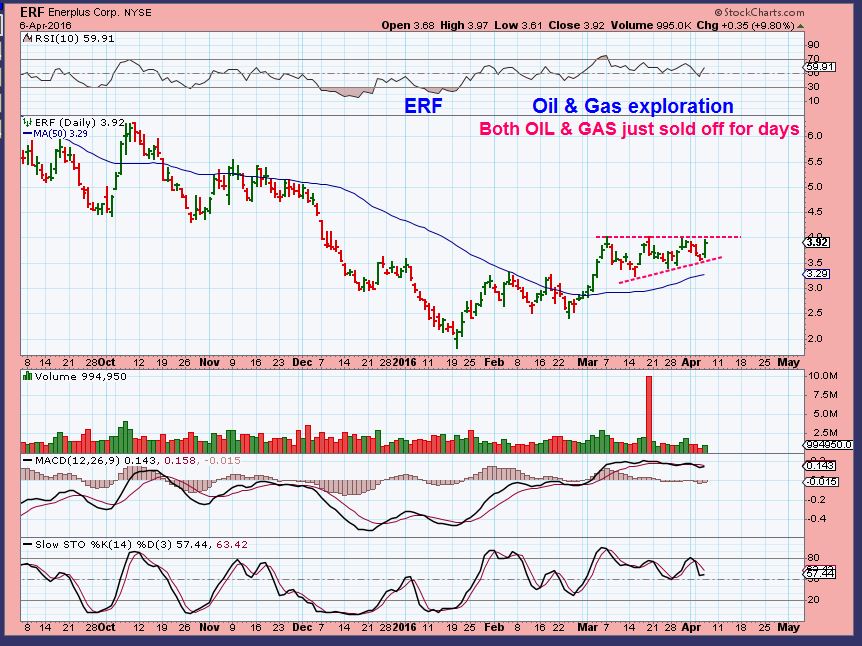
ERF – It ran to $4 and consolidated into a Bullish pattern. I recommended buying this consolidation, because OIL sold off for 9 straight days and this did not.
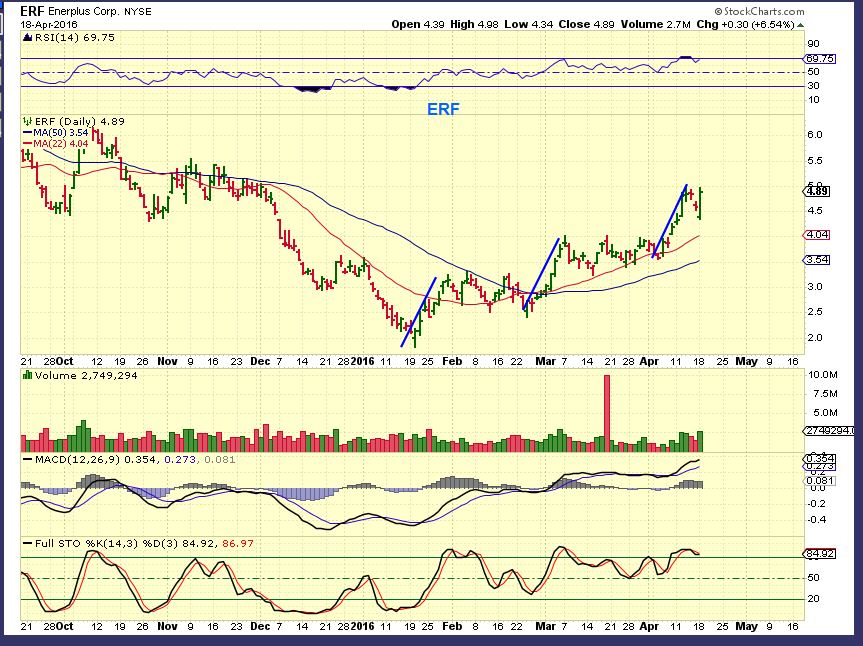
ERF Monday – After completing another measured move, it dropped today with Oil and reversed higher, actually closing up 6.5%. This has now moved from $1.84 to $5. Great gains.
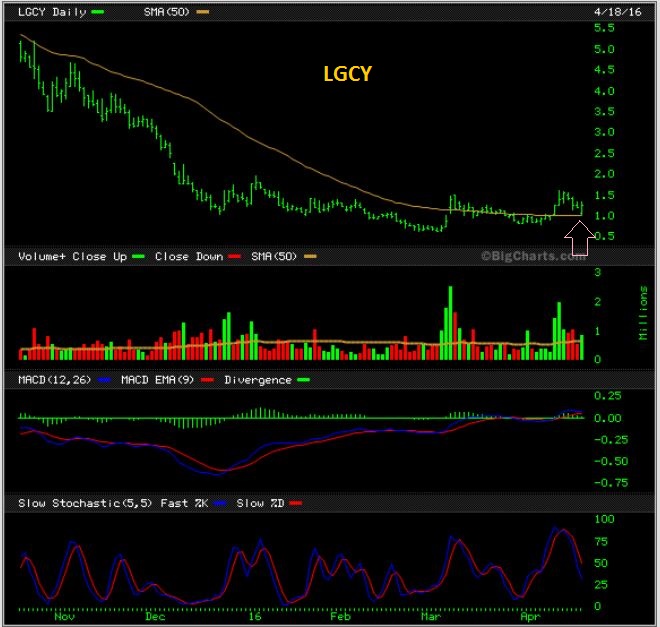
Finally LGCY– This energy stock moves in huge swings. It is scary at times, but this big picture is helpful if this is going to recover too. It was actually over $30 in 2014.
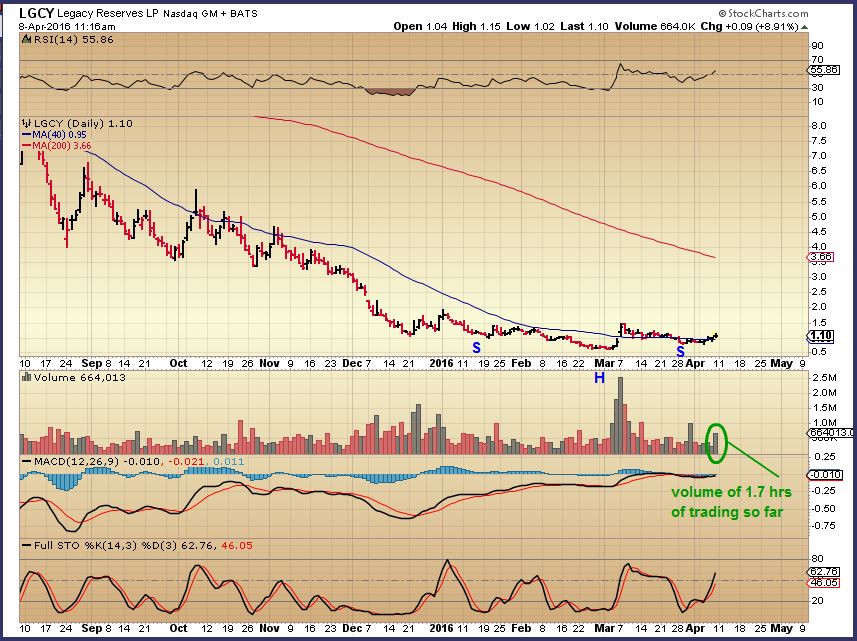
LGCY dropped to the 50sma and started moving higher Monday morning. It also ended up green for the day. Still a bullish looking base.
So please note that in every chart of a stock that recovered, it was NOT straight up. There were many boring consolidations. Mondays drop could be considered part of that process.
.
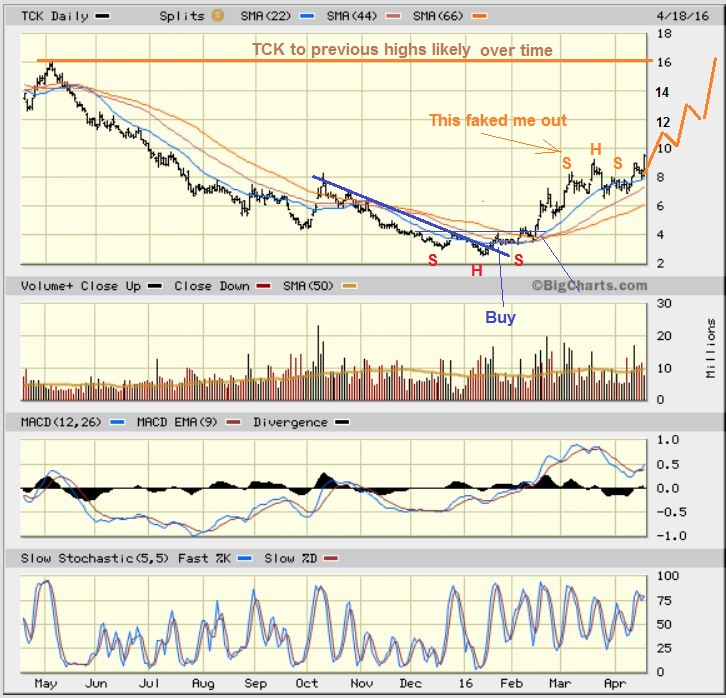
As a part of this lesson, I also wanted to show TCK. What a great looking run, but it too got a bit scary at one point in the consolidation.
Jan to Feb – $2.56 to $7.25 – NOT straight up. Notice the sideways boring moves and volatility.
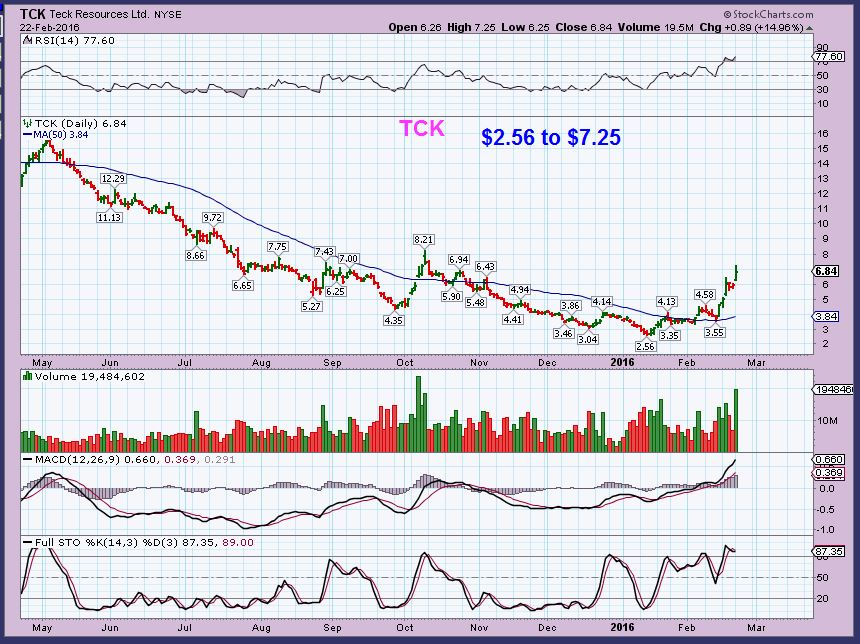
Then it got stuck under resistance and went sideways from $6-$7. That’s about 10 days or 2 weeks of trading.
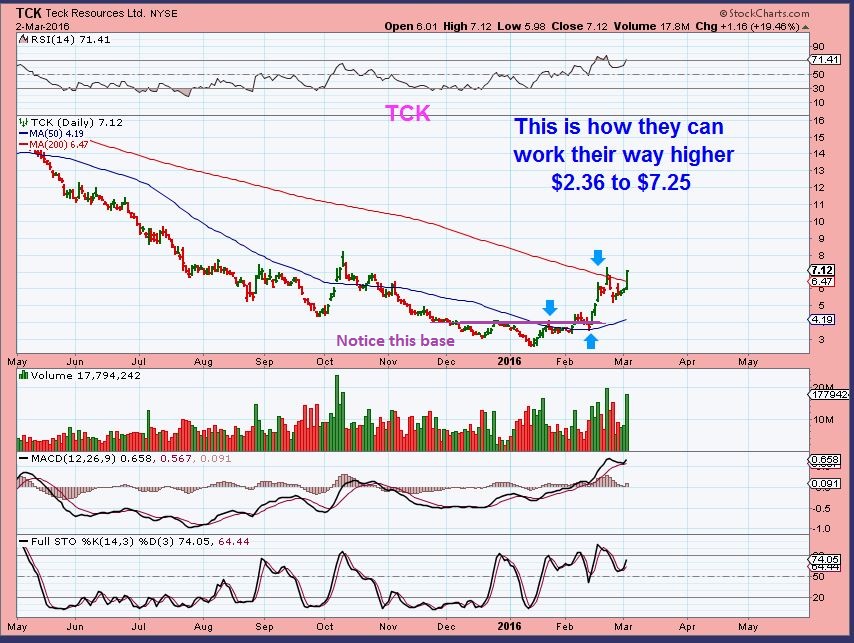
TCK Monday – Sideways for over a month now and I even warned about a possible H&S , but it never played out. TCK is now breaking out, possibly for a strong run out of this consolidation.
.
Finally – I found a new stock ( New to me, I have never heard of this company). Hudbay Minerals. They released earnings on Feb 24th , and the stock went higher. Their next earnings release is April 29th. They are mainly Copper Mining. Gold & silver also.
.
HBM – ( HUDBAY MINERALS) – I bought it as a trade since it bounced off of its 50sma and it just kept climbing. It has a long consolidation and a possible inverse H&S , so I will hold on to it until it tells me to let go. I see TGD, VGZ, AUMN, GSS, etc still running strong, so I will try this one until it lets me know that it doesn’t want to run.
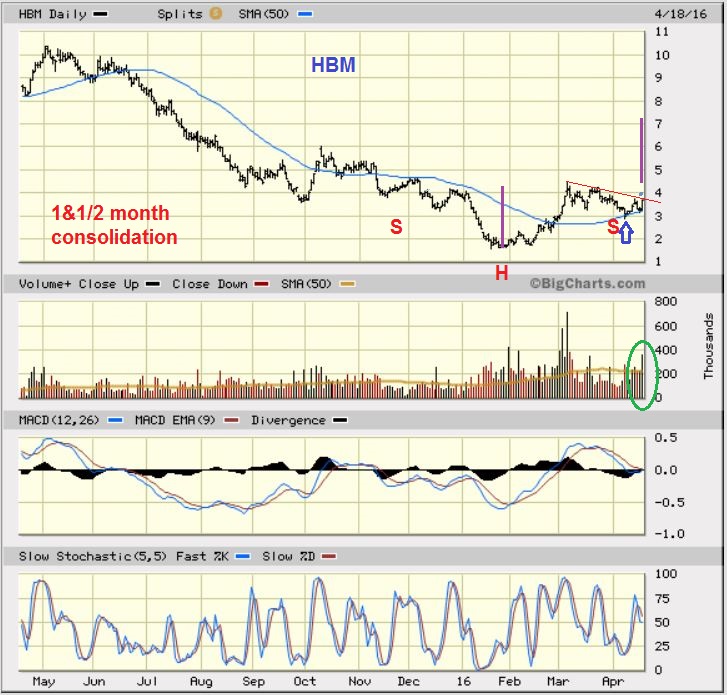
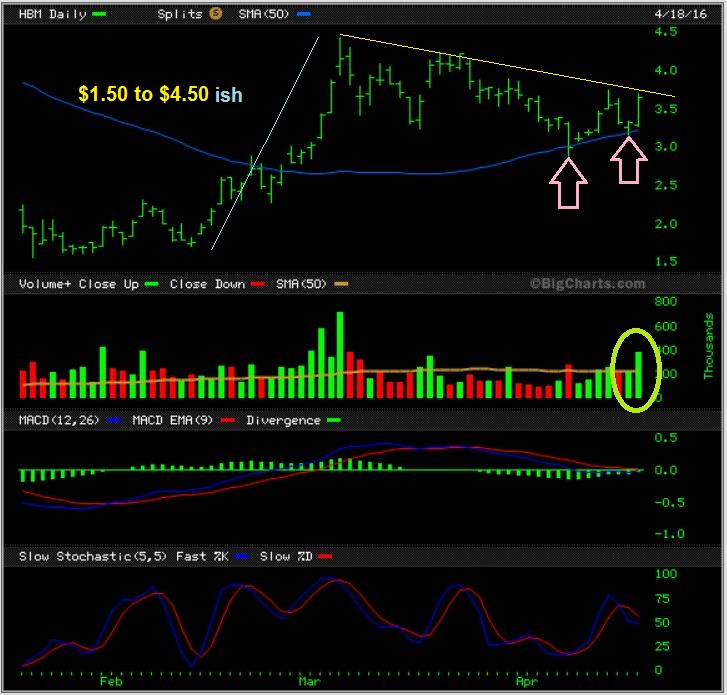
HBM close up– I think it may be ready to break out, so someone here also may want to trade it also? Just remember that it is a Copper / Gold Miner and could get caught in a pullback if Gold drops. You could use a stop under the 50sma, or just sell a quick POP if we get one. So far, trading in certain Miners has worked out well.
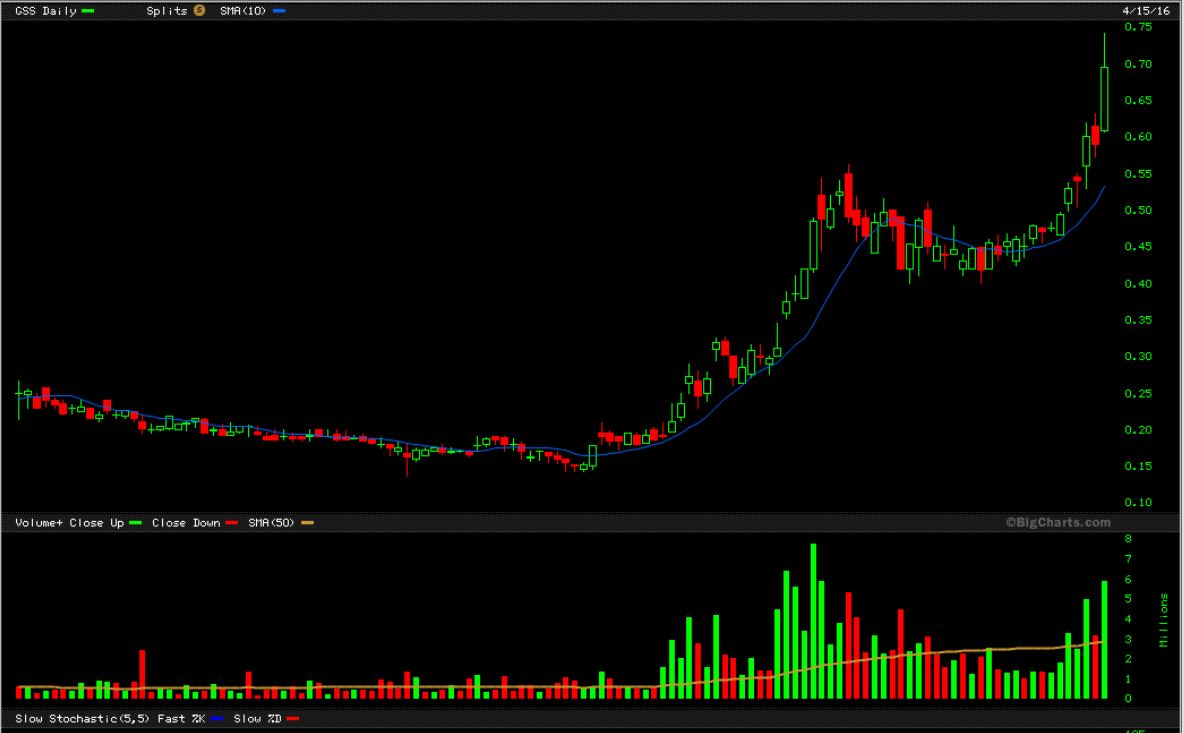
Like GSS in this chart from the weekend report. It continued higher Monday too.
.
I hope you enjoyed this Energy Sector Review. Best wishes and thanks for being here!
NOTE: It’s just $95 for a full 3 months of membership, a fraction of what one stopped out trade is likely to cost you. Consider joining ChartFreak and receive hundreds of chart setups and ideas. See >> CHART FREAK – QUARTERLY
~ALEX
It's all a matter of perspective. If you fell asleep Sunday night and didn't wake up until after the market closed on Monday, you may have thought that not a lot had happened. If, however, you read my report Monday morning , you saw that Oil had dropped 4% overnight. CNBC and many other sources of information where lit up. Was 'Oil dropping to the 20's again'? Was it 'a great time to go short'? No, Cycle timing and the charts were pointing to possibly just a small pull back. We are invested in Oil & Energy, so this was important. This was our Oil chart in the report.
.
WTIC - Oil was early in the 2nd daily cycle, and the first one was R.T., so I expected more than just a day 6th high in this run. Maybe we would get a gap fill?
WTIC MONDAY - Many ( Not here at Chartfreak) likely jumped in on the short side pre-market, but the shorts got overwhelmed. This reversal did fill the gap and it did something else too...
Notice this important observation
Read MoreThe Markets continue moving along, but in some cases we are not quite where we wand to be yet. Lets review...
.
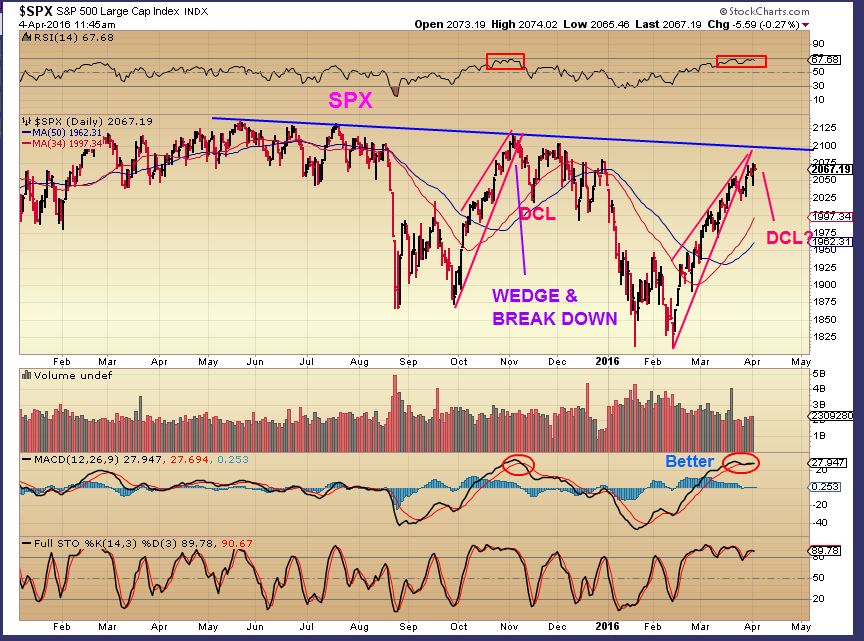
This was the SPX in Thursday mornings report.
Now lets look at the Big Picture as of Fridays close
Read MoreIts Friday April 15th, so I wanted to remind you that it is Tax day in the States, and I also needed to offer a clean slate in the comments section, since yesterdays comments section was FULL. 🙂
.
General Markets : We watched the markets break out Wednesday
...
Read MoreI cannot believe how nicely these markets are getting their ducks all lined up in a row. This report is going to be as long as a weekend report! You may even be a little surprised to see what I am about to show you...
.
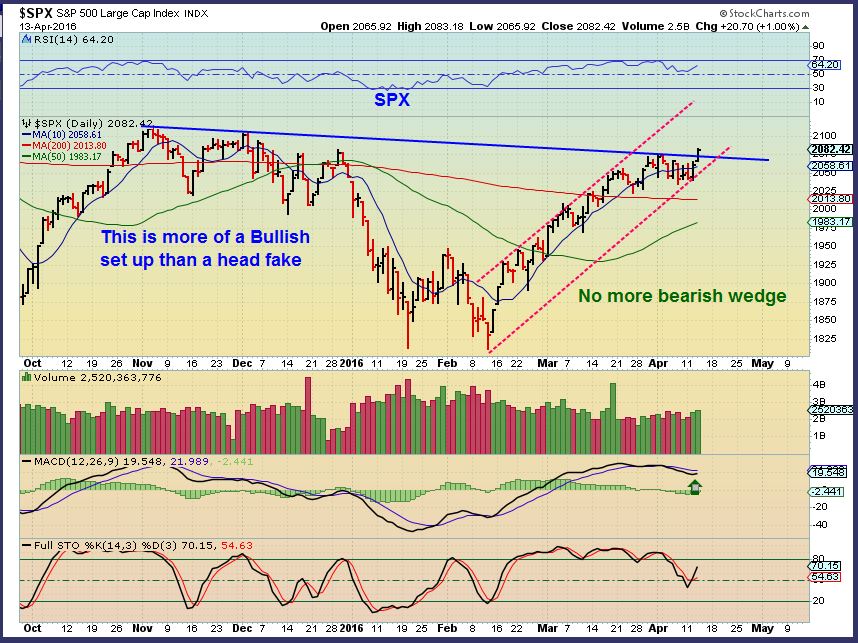
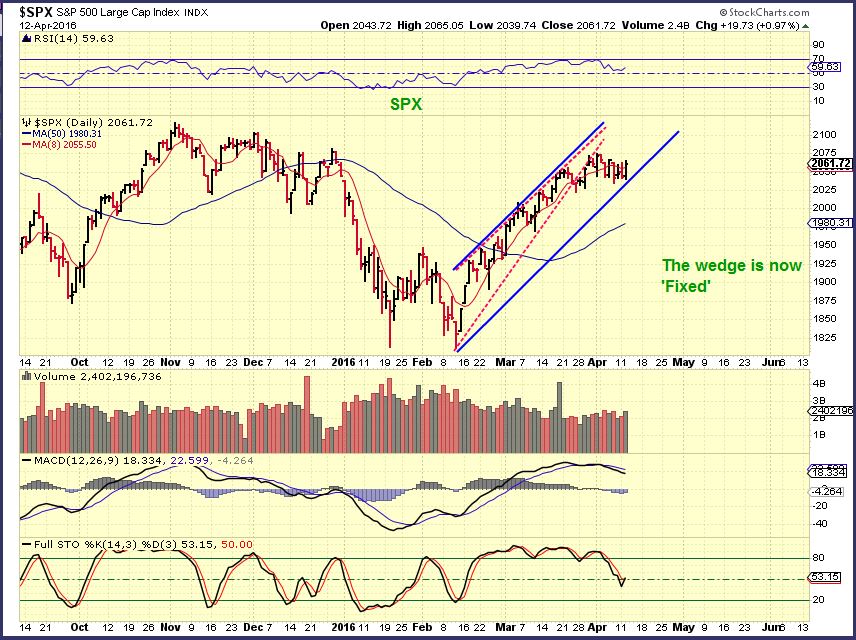
SPX - Tuesday I pointed out that the wedge had resolved itself.
Break out
Read MoreI recently wrote up a public post showing what we have been invested in as far as Gold, Miners, Energy, and Commodity Stocks. With careful analysis, we have been able to catch blast off after blast off in a variety of sectors. These runs do not last forever. They run up, then consolidate those gains, and if conditions remain bullish, they can enjoy another run higher. Lets review how we've been doing that.
.
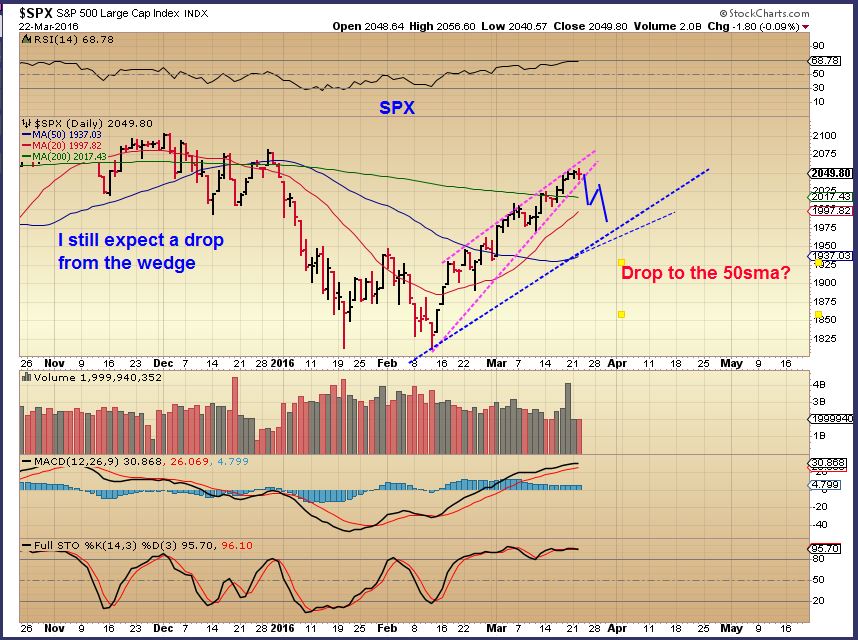
I did call these lows in the General market notice that we did get the expected run higher. I then pointed out in MARCH a bearish rising wedge, so caution was warranted. A drop was expected.
In todays premium report I showed that Yesterday we saw a reversal and the sideways action has 'repaired' that Bear Wedge. It now could be a channel, and the markets can resume their up-leg.
Read MoreIt is NOT easy when you have a stock up 10%, and the other 4 or 5 are up 20% 34% and so on , but we'll just have to deal with it 🙂 . Yes, I'm kidding, but seriously that is the way it has been lately. Dont get used to it, it can be short lived reward for the patience that we have put in. Lets discuss selling and rocket ships after a quick review.
.
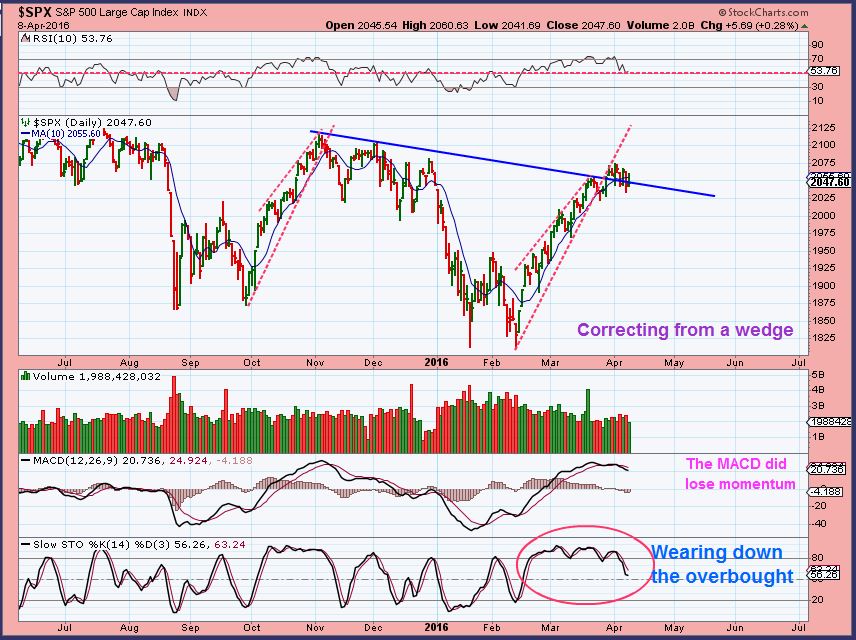
SPX April 4th chart - I pointed out this bearish rising wedge and called for the markets to stop rising as a result. I said that I then would expect another run higher.
SPX - Those wedges can cause a drop or a sideways move that can correct the wedge, and so far we now have a channel . That wedge has fixed itself.
Read MoreUsing the April 8th (Fridays Chart), we see the markets consolidating sideways. This usually prepares it for a directional move , up or down. In this case, it can also take that bearish wedge and allow it to become a channel.
The Markets continued that sideways move on Monday...
Read MoreMy weekend report had over40 charts, some for educational purposes and others to point out a few trade set ups. We have been focused on specific sectors and I wanted to focus on what I think could be important at this moment. I'd like to share a small portion of that with you here.
IBB - One area that I've been stalking lately is the the Biotech sector. It has been bottoming for over a month and broke out recently. Lets review what we've been watching.
IBB March 21= double bottom base
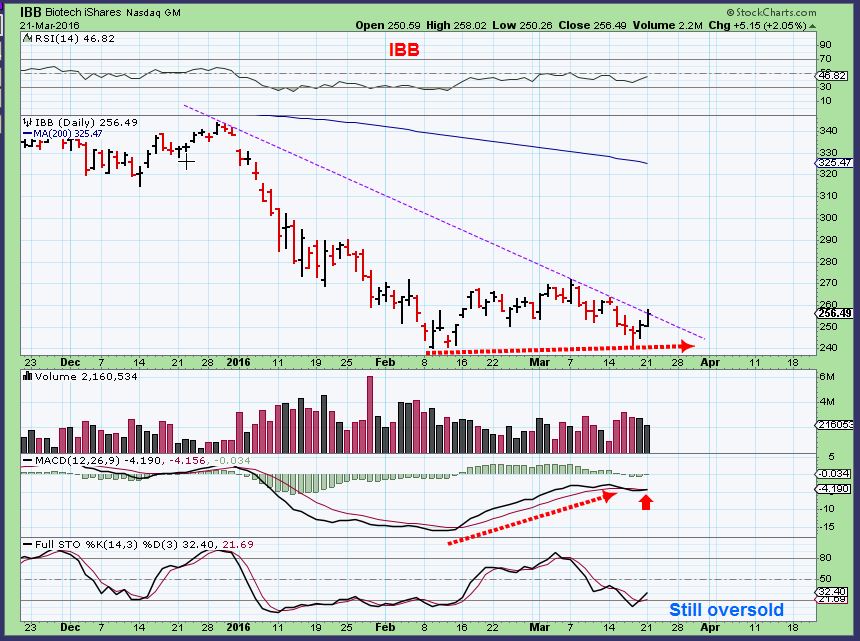
Nice break out (But notice the resistance on the left. Were there buyers there hoping to sell at break even?).
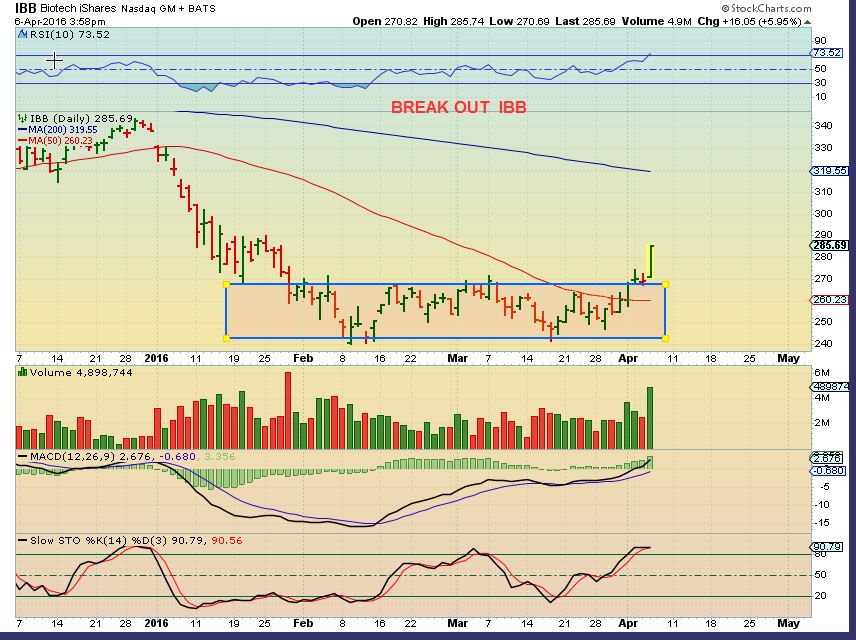
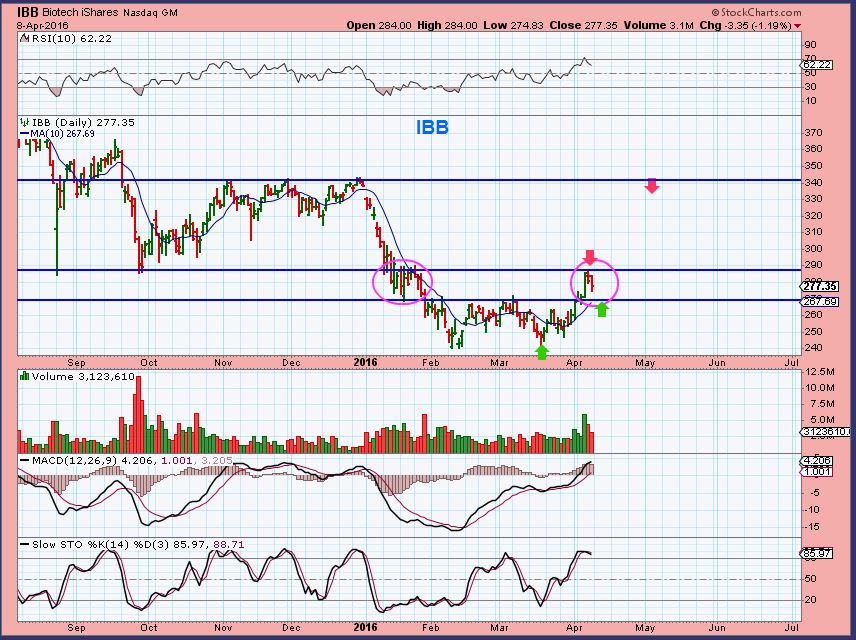
IBB WKLY - Apparently so, sellers may be present, but I expect this to go higher when they are out of the way. Thats a nice base. Support is now near $270-$275, The saying is "Buy the dips , sell the rips".
.
SO I HAVE BEEN DISCUSSING BIOTECH IN MY REPORTS
.
Read MoreThe environment for trading in 2016 has been excellent for traders and investors that knew where to look. If you have been a subscriber since January, then you have seen so many trade ideas blossom and grow. We have been finding various sectors that had bullish set ups that many were actually afraid to trade in. Coming out of their lows, the potential has been tremendous if you know what to look for.
.
For example, just look at this one stock.
MUX - Whether you traded it, or bought and held when it was recommended, it is up over 100% from its lows.
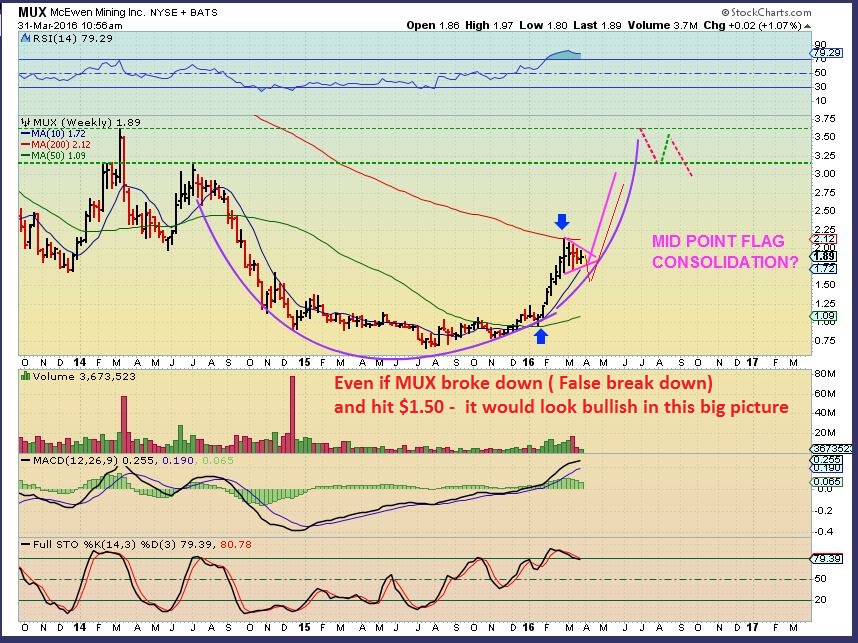
Lets look at a number of current trade set ups with conditions that favor the upside...
Read More
Scroll to top