PUBLIC REPORT : Is Silver Really A The Weak Link?
I am not what many consider to be a Perma Gold Bull, but I do expect a 3rd phase of the 2000 Gold run to take place and end in a spectacular blow off top phase. That being the case, I also watch intently when we get these bear market lows for signs of a bigger picture change. Lately I am hearing that “Silver is weak”. “Silver cant get out of its own way. It is setting up to plunge now.” I’ve been discussing these lows and successfully trading them for weeks now. Is that the way I see current conditions? Is Silver really the weak link? Not the way I look at things. To the charts…
.
Looking at GOLD first may help us with Silver
.
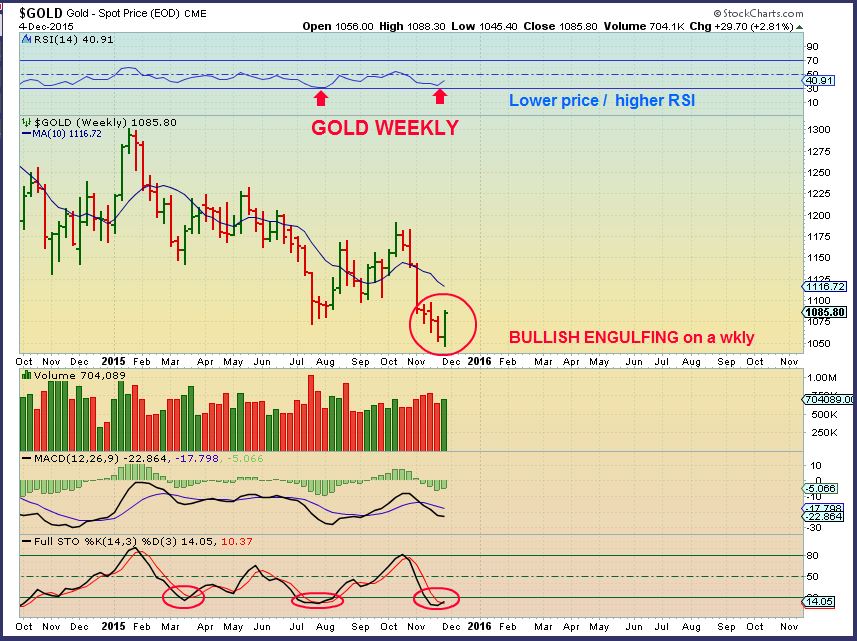
GOLD – 2 charts – Chart 1 – Lets take a look at Gold when it bottomed back on December 4th. I identified the lows with a weekly Bullish shake out ( And a few other daily charts showed further confirmation of lows).
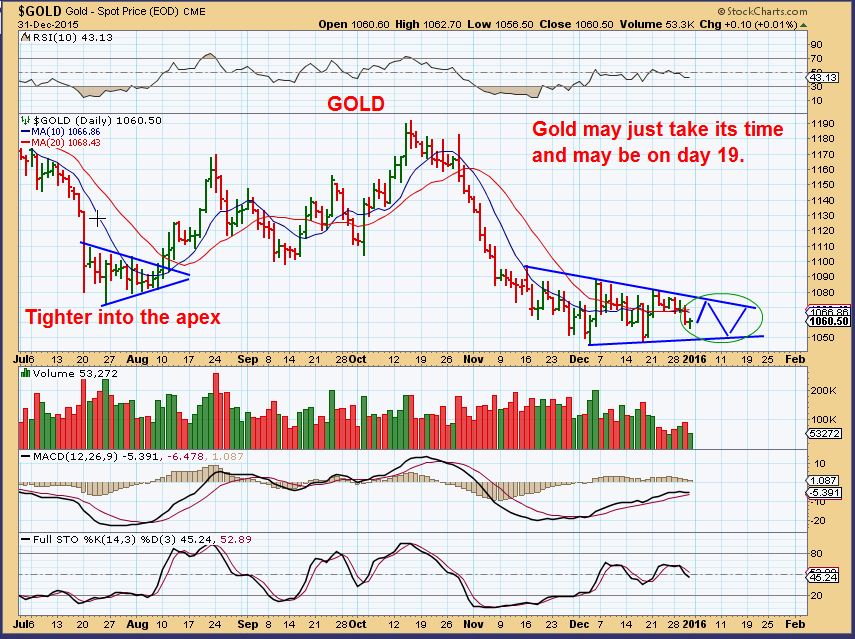
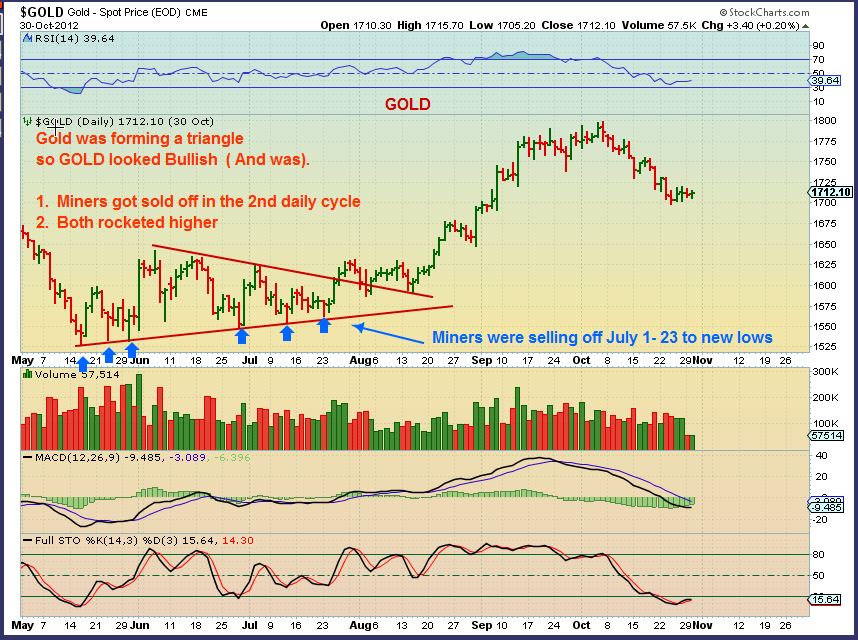
Chart 2 – As Gold meandered at lows, I constantly heard “Gold is weak . It cant even rally. We are going to plunge to $1000. I am going short.” I pointed out that a Triangle was forming at the lows and mentioned how these often deceive people as a weak. They then break out higher (See the left side of the chart).
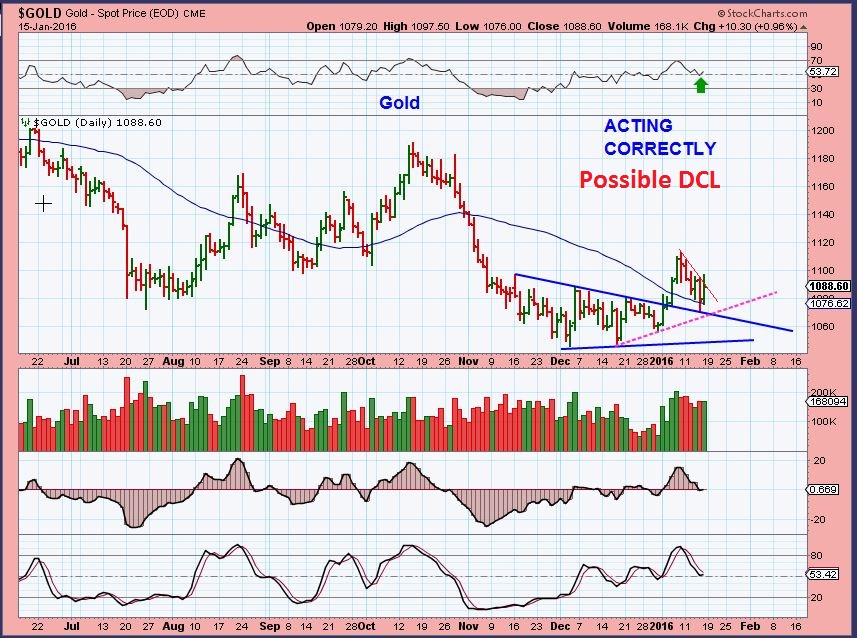
GOLD- It wasnt ‘weak’, it broke out but Miners broke down. Many said that is very bearish, so…
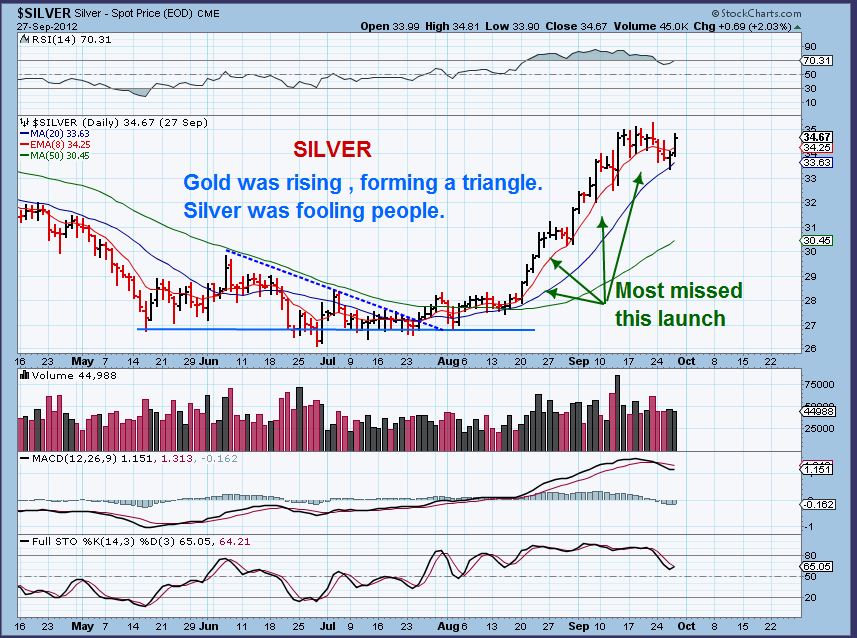
To add confidence to our recent lows, I pointed out a triangle that I remember trading in 2012. It was VERY TRICKY. Gold broke out and Silver & Miners broke down, just like in January. Soon Both ran quickly higher leaving many behind ( Afraid of the weak Gold, Silver, & Miners).
PLEASE NOTICE THAT GOLD WAS CLIMBING from MAY – AUG. WHAT WAS SILVER DOING?
SILVER fooled people into thinking that it was “Weak?” Gold was rising in May , June, July, Aug with higher lows , but Silver was not. Notice the triangle though.
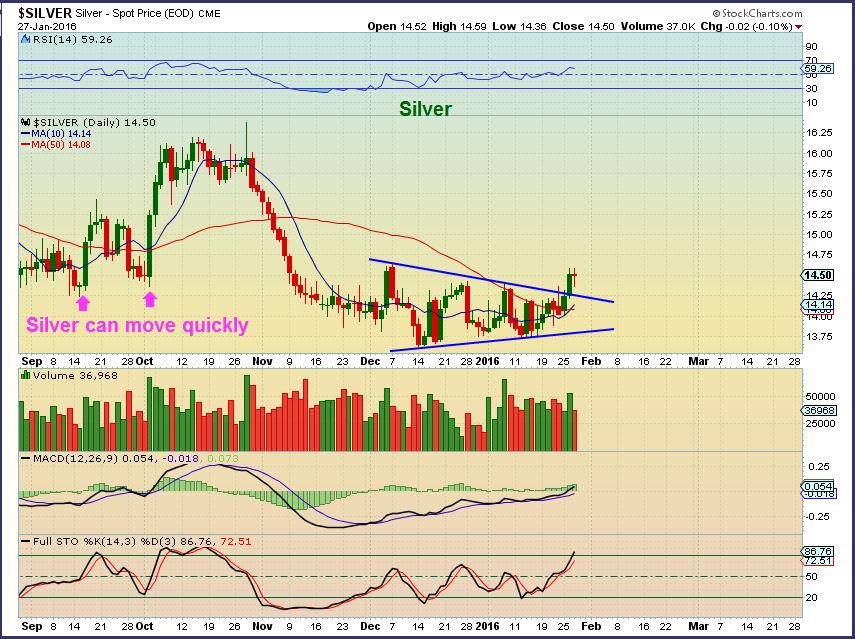
SILVER – This is how I was viewing Silver recently, while GOLD took off and silver “looked weak” to many. Did you read that too? In my premium reports, I was saying to expect Silver to POP higher soon.
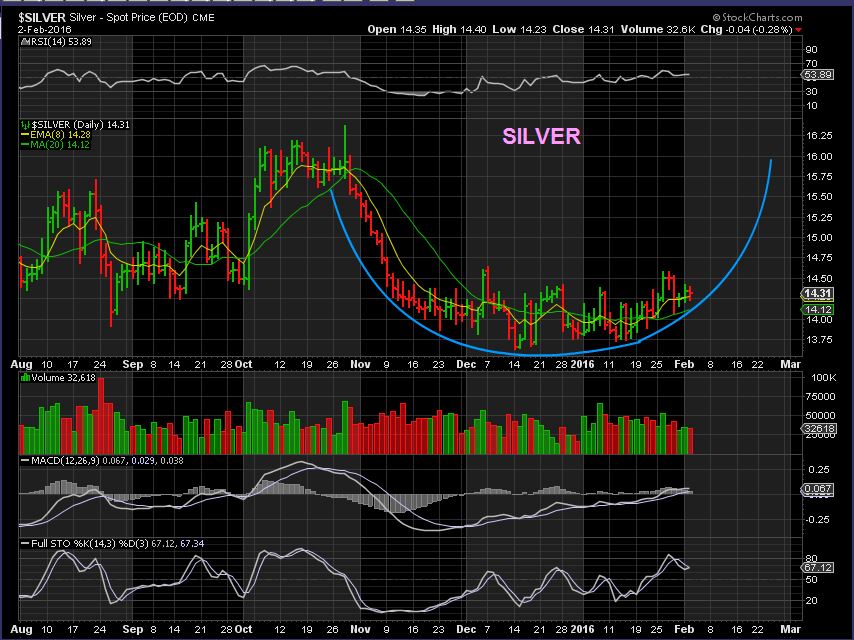
This is my SILVER chart in my premium report this morning. Set up to break down? Weak?
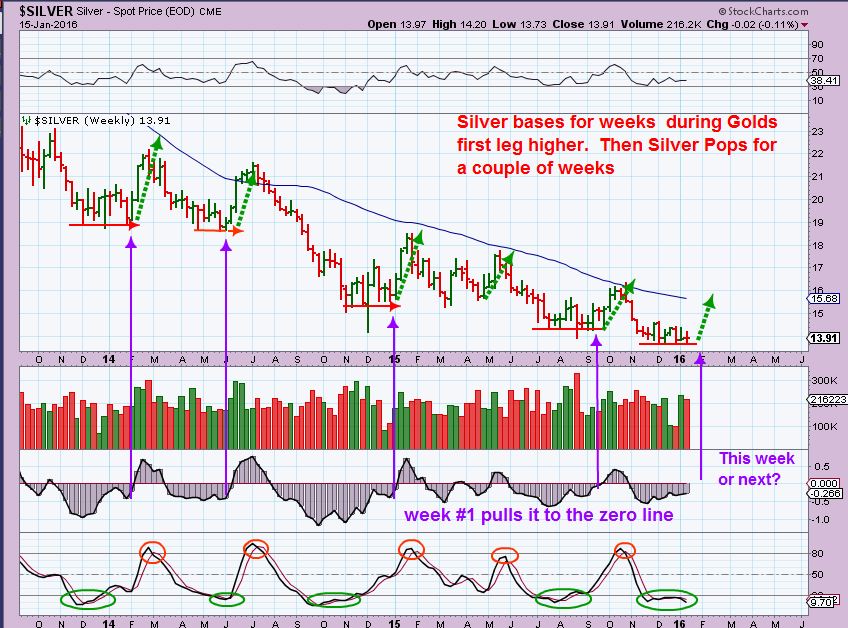
My Jan 15 chart – This is why I tell my readers that I think Silver will continue higher. I use a special indicator that is lining up as expected. The pattern of Basing & then the surge happens , even in bear market rallies. We’re basing, how about the pop? 🙂
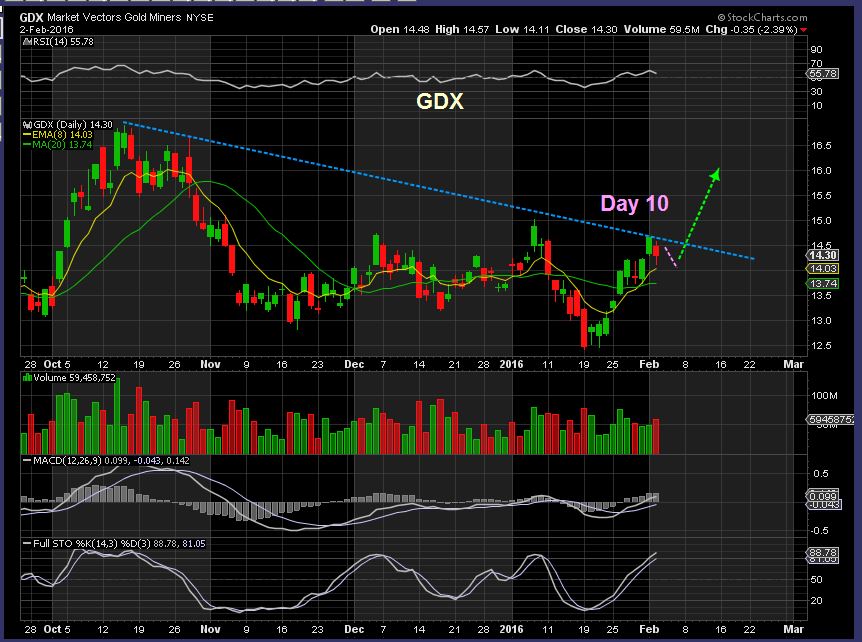
GDX Tuesday – On day 10 and at resistance, it is strong but stalled for a moment. Can it break out?
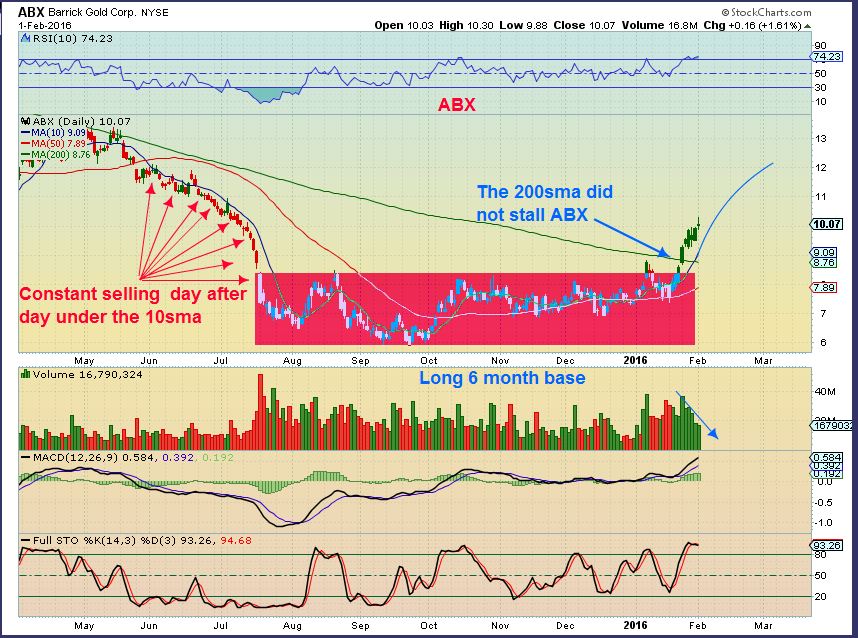
The possibility of a bullish GDX break out is helped when we look at other miners. ABX didn’t hold back at resistance of the 200sma. 🙂
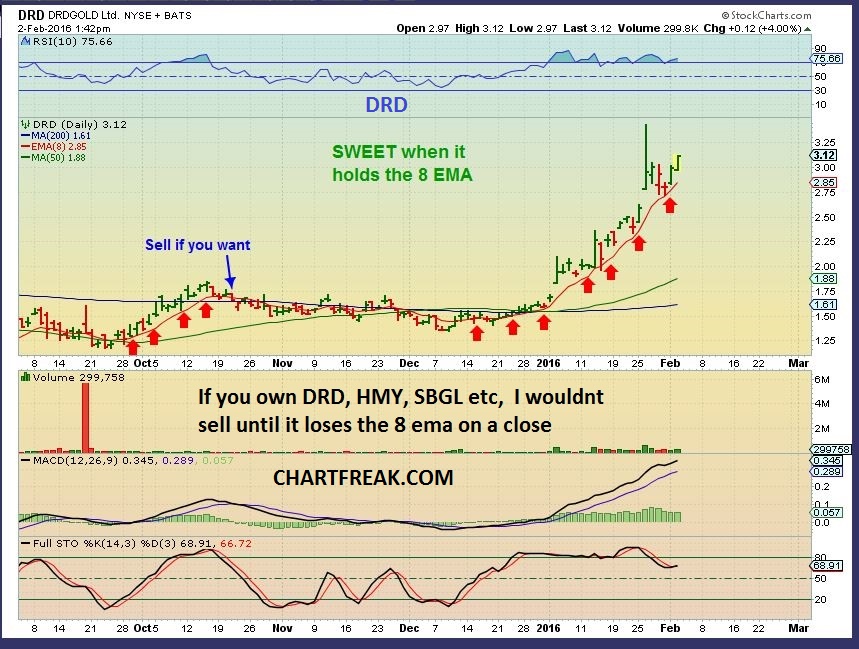
DRD – See HMY, SBGL also. Many Miners are moving higher. Can you imagine this happening in GDX / GDXJ? It is possible in my humble opinion, when the tide finally turns in phase 3 of the Gold Bull. Huge % gains will be made by those that know what to look for.
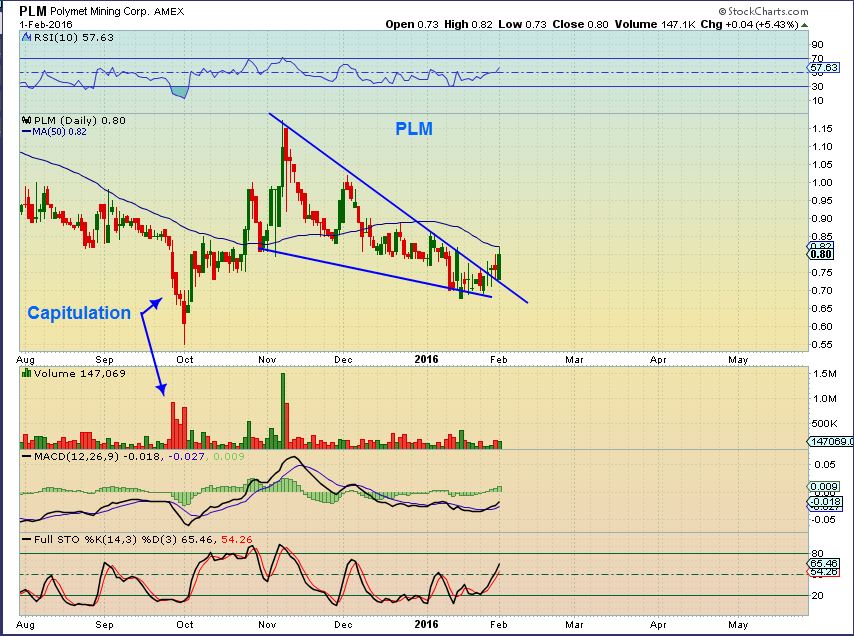
Yesterday I posted the bullish set up in PLM, after someone asked me to keep an eye on it last fall.
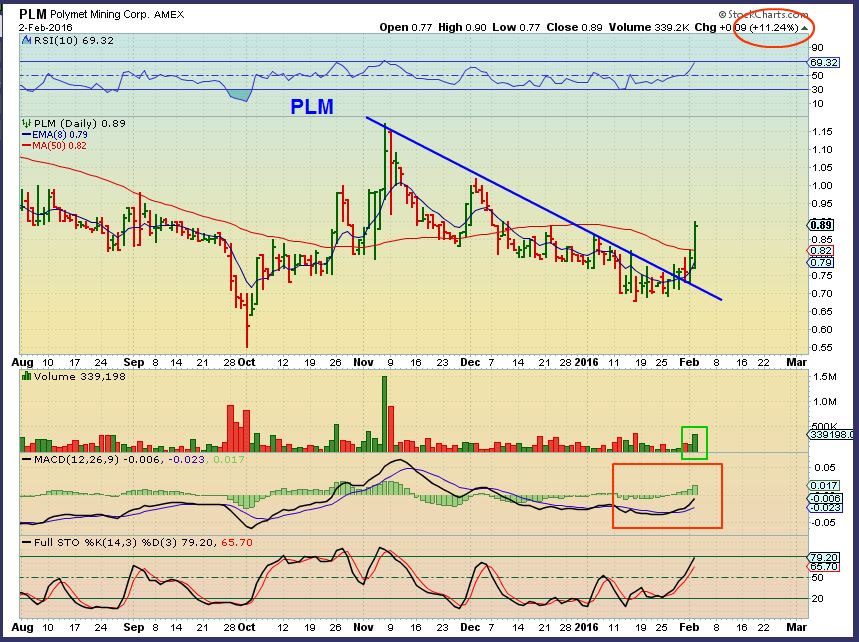
It broke out . I think it could have a lot more upside, with a possible target being the former high volume highs getting tested.
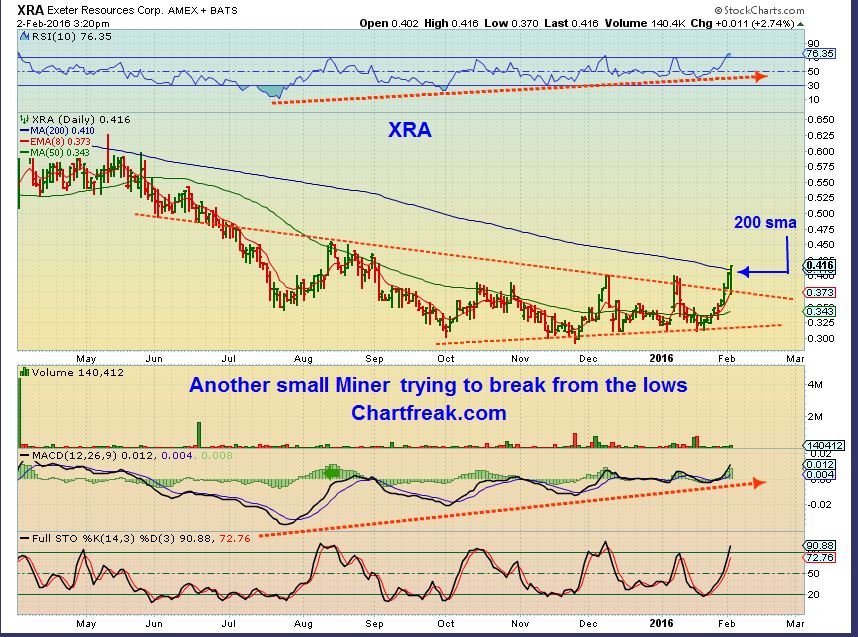
Yesterday when many Miners were selling off a little, we saw another small Junior breaking out over the 200sma. This is encouraging to the overall big picture. I am starting to wonder how quarterly earnings will be for many miners with OIL & NATGAS holding at lows for so long now. Much of the cost of Mining is due to energy – so low costs can add to their profitability .
MUX – Have you seen this one lately? It was a BUY at $1.00. Its at $1.37 today.
.
So is SILVER still looking weak and ready to break down to you? Sure, in these markets anything can happen, so we use stops, but I hope I was able to give you another way of looking at it. By researching similar chart patterns in the past, we see BULLISH probabilities in Silver .
.
And what about that BIG PICTURE? Is it shaping up at all or still just looking ugly like an ugly bear market.
.
HUI is on support and has been consolidating there for 6 MONTHS. A break out higher will eventually bring us the best trading that we’ve seen in years. I have been there in 2000-2008 and 2009 to 2012. Look at 2008 – 2012 on the chart below. $150 to $630+.
.
I believe we are close to some very profitable trading for years to come. Thanks for being here!
.
If you think that getting a second set of eyes on the markets would help you with your trading, why not sign up and try it for a month at $37.95? You get access to all of my past reports and future reports for the month. I think the 2 weekend reports that I posted this past weekend alone may have been worth that. It added confidence in the Silver set up. 🙂
.
To sign up, click here and scroll down
.


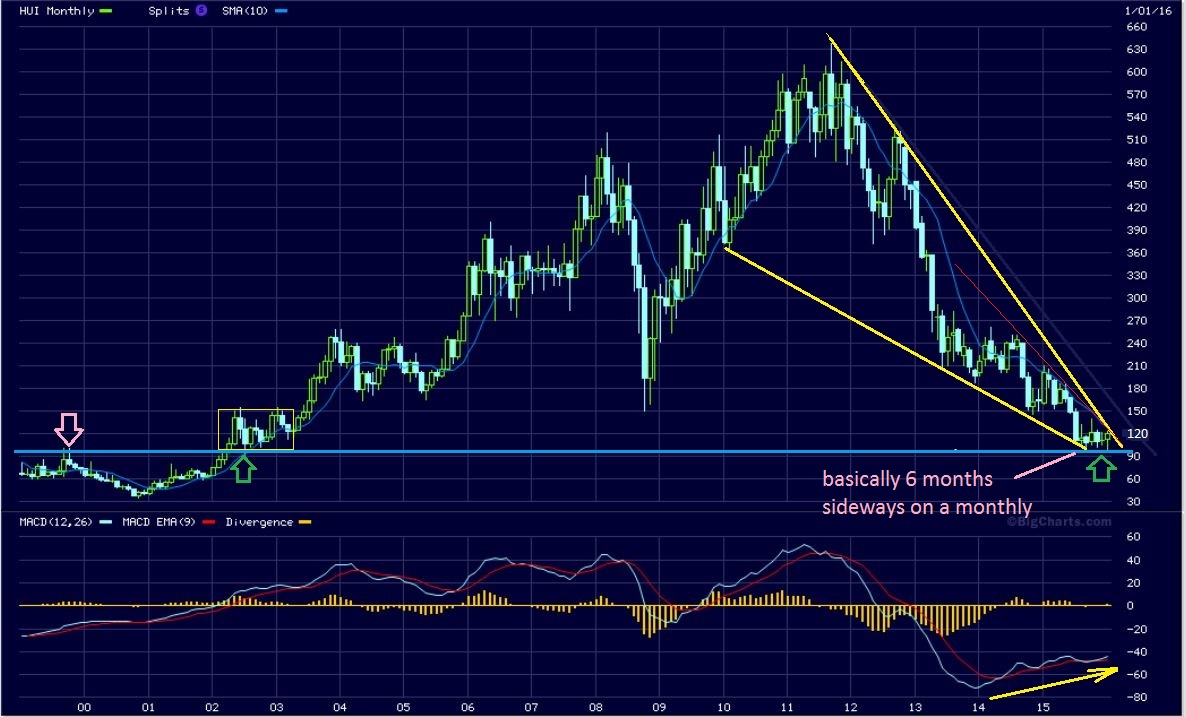


That final chart is the real key. Short term and long term charts are aligning. Gold and miners are going to begin a long term move sooner or later.
AEM looks like its breaking out today if it can hold the gains.
Hi Alex – Quick clarification on your oil chart. So, are you thinking that the lows are in or is it too early to tell ?
Let those Miners run…….. 🙂
giddyup
Speaking of giddy up ing …….. where is that Oil count from you ?
lol… damnnnnnn … ok
LOL !!
long term-mnthly??
or daily
..hrly??
Give me all ya got girl …….. 😉
Daily and Hourly would be wonderful ……
K
oooooo .. I kinda like it when u order me around like that…
A perfect back test of the TL on SPX……I hope some others also caught it.
… did u happen 2 catch how CF took a page outta your book and went ‘off the charts’
** imitation – highest form of flattery 😉
😉
What a blast off! I haven’t seen that in a long while
yeah… SA even appears 2B gettn off it’s deadA$$..
I bought some SA Yesterday. Looking great Today. MUX is refusing to move higher, must be tired.