
Public Report – Bull Flags
I wrote a report about Bull Flags for the premium members last night. Why? Questions have been raised.
.
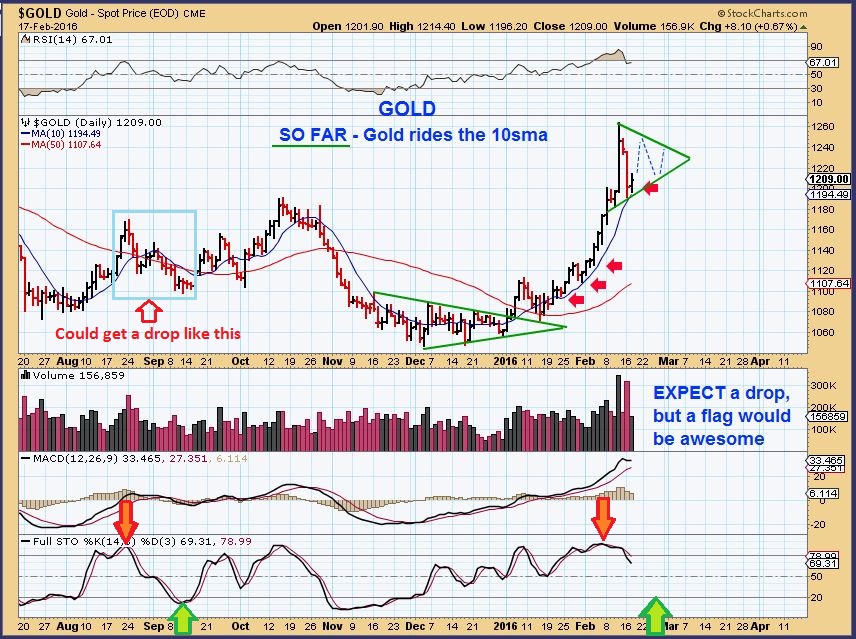
On Feb 17th, after the recent run up in Gold, I mentioned that Gold could Pause and form a Bull Flag. These are often just a pause along the way (although they can fail).
Feb 17 – I discussed a possible Bull Flag forming after a strong run higher.
Feb 24 – We have the Flag and as mentioned, it is often just a pause before continuing to run higher.
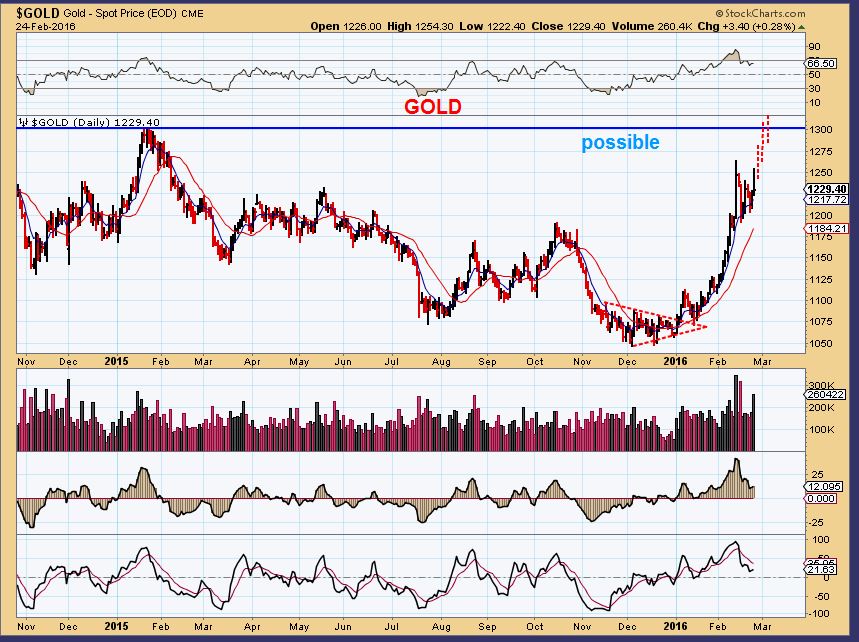
Well on Friday Feb 24 Gold broke out and dropped. Many said Gold failed at the Bull Flag. Friday Feb 26 ( Today) Gold dropped down to $1212. Does that hurt the Bull Flag and prove it is a failure, like some are saying?
No- Let me show you 2 ideas that are not a stretch or grasping for straws. These are legitimate patterns playing out .
Gold Today – This shows how Gold dropped today ( And then recovered to $1222 so far). This could be a back test of our break out , not a failure. That would be bullish.
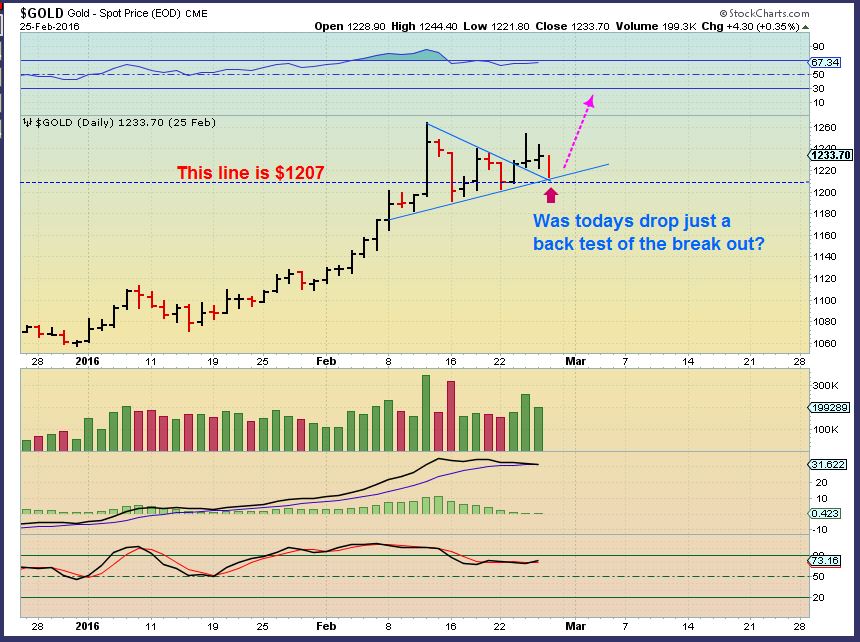
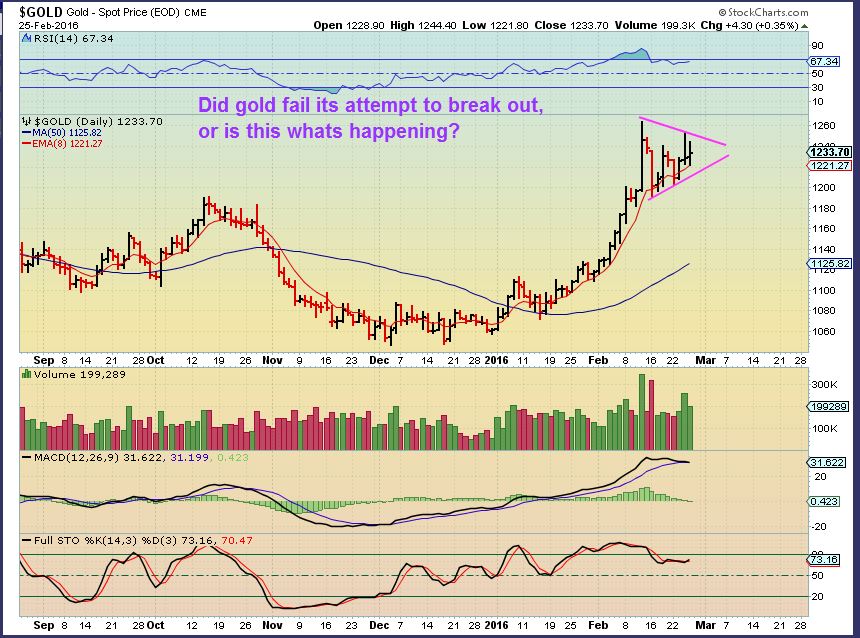
Gold As of Feb 25 – This shows that the break out that many say failed, may really just be setting the upper trendline , for a future break out. This flag actually looks like the first one that I drew in on the first chart of this report.
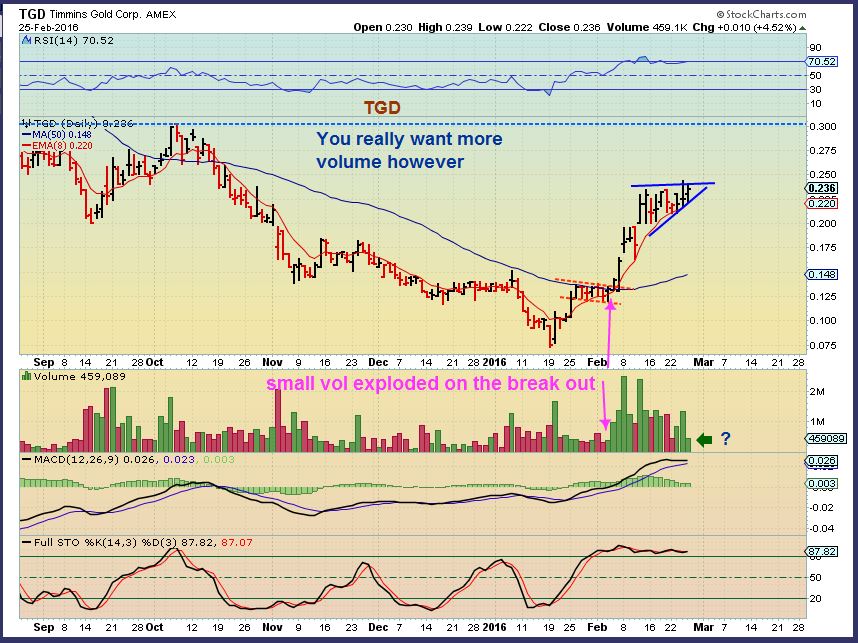
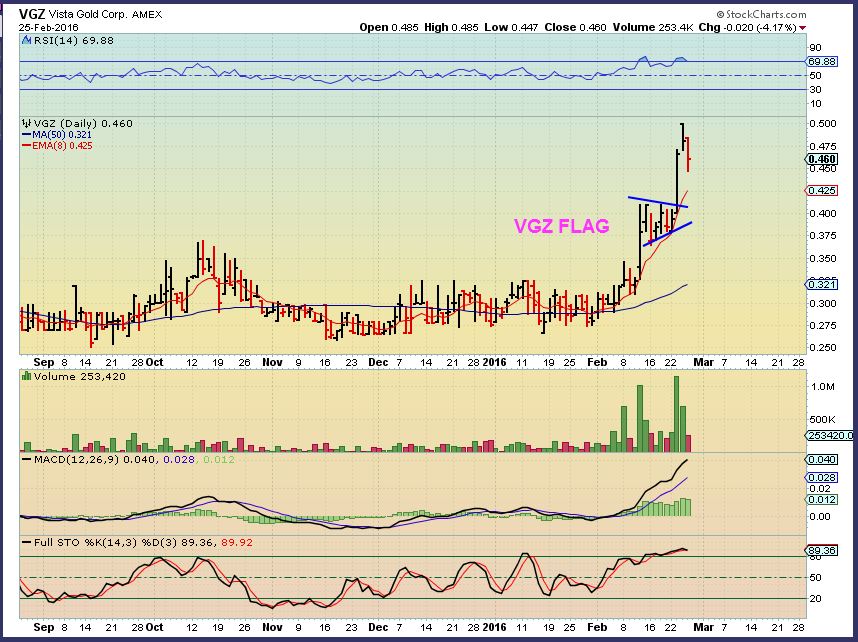
Then I started seeing similar bullish formations like ‘Bull Flags’ and ‘Ascending Wedges’ in various Miners. SO I put several Miners in my report Today in the premium section, to keep an eye on.
Here are 2 of them :
TGD
.
VGZ had one this week, and it acted correctly
.
I am NOT saying that these bull Flags cannot fail and lead to a pull back into a DCL soon, but they can also just get ridiculously overdone to the upside first. These Bullish patterns are consolidations allowing overbought to unwind a bit and then they usually carry on upward.
Todays public report and premium report gives us a few things to watch for, to see whether this remains a runaway type of bullish run, or is a deeper correction starting.
.
I will discuss other factors with premium men]mbers too, in the weekend report that will be out by Sunday night or Monday morning, before the market opens. Have a great Friday & weekend!


SUNE – up 36% yesterday, up another 35% pre-market , but down HUGE over the past months
http://realmoney.thestreet.com/articles/02/25/2016/denial-injunction-lifts-sunedison-shares?puc=yahoo&cm_ven=YAHOO
Yeah, I saw that on marketwatch, but Inetersting how it was up 36% yesterday, and that news didnt get released until last night at 6:30 P.M.
So it’s either a bounce, or someone always knows something ahead of the news. I always see things in the charts before I see the news.
It must have been common knowledge, someone here in my office was talking to me about it Yesterday as it went up 36%. He knew the story.
Surprised you didnt buy it off of the lows with that info ( Just for a quick trade, may just be another bounce)
It was already up 36% when I found out about it
Good morning, Alex
Thanks for this report and your coverage of SSRI – it’s been on my wish list for awhile and your noting it made me take a look. It looked like it was going to break below the pennant on opening but seems to have recovered (we’ll see) giving an even better entry point with a closer stop loss – so I took it. Thanks again!
[
PAAS has also been on my wish list (based on fundamentals, like SSRI) – today’s opening had the same tiny fake-out lower opening, but is still in it’s ascending triangle. I’m buying now – do you think it’s chart-worthy, Alex?
Paas actually looks good.
SSRI seems to be dropping below the wedge lower line. Not sure how this will shake out.
Some Miners holding up pretty well considering that Gold went from a high of 1260+ to now being near $1210
Considering that 5.41 & 5.27 are the two previous lows inside the pennant, what stop would you use for your trading? I’m looking to get in longer-term, but don’t want to pay more than I have to (of course)
X and SWC finally in the green for me.
Looking at X, need some EW help here. I see on the 15min chart we are in wave 3, which should get to $8.73 as 1.618 of wave one? Is that correct? Maria, Alex, anyone?
I can see the former/ recent high of 8.80 is possible in 1-2-3-4-5 rise higher on the 15 minute chart, as top of 3, and then a small 4 down and new highs on 5 , but I’m not personally dissecting these as day trades.
I am looking at CENX, AA, AKS, X, etc as buy & hold until something breaks.
AKS, CENX, FCX etc up around 10% today 🙂
Some of these commodities are really acting correctly as a stair way higher, so far.
Until something breaks? Oh, you mean the chart pattern failure. Got it.
Yes, right , or uptrend breaks down, things like that.
sorry Bill.. can’t chart now. will look later.
I still really like SWC , especially since the earnings came out .
its still above the 50sma, and it is also holding the 8 ema / 13 sma for the most part.
Those are the areas that I am watching
30 minute chart looks very bullish. All my signals look positive. I could see $8.20 by the end of the day
Bought DUST this morning, looks like it wants to run! Day trade………
Refresh for a chart from 2-19
.
SO I think most here know that I bought TRQ for that “Crawl under the 50sma”. Then I got bored with it day after day, not really gaining & holding while other miners did.
SO I Sold it for a small profit . On a down day in Gold, it is now breaking higher with good volume. Looks ready to run : )
It happens…ARGH!
its ok .. I bought some yesterday- i liked it. 😉 so thanx
giggle
You’re welcome.
P.S. Your pants are on fire ( LOL – I cracked myself up with that one 🙂 )
Like, “Liar, Liar”?
Bill got it 🙂
Huh?
:-O
U’ll be eating crow soon… 🙂
Vanguard won’t allow me to do a screen capture. .good news actually..
Finally, someone can hold Maria back 🙂
P.S. VSLR – another that you used to mention
Uhh.. what’s the opposite of yes…
Use the windows snip tool, captures anything. Meow!
On my android?
You dont need to prove anything, I was kidding. ( Or take a Screen shot on ur phone and give us ur acct number?) 🙂
Lol. Just doesn’t sound right..when u do it..lol
CJES ( up 33% today?) OAS, PKD, KEG, BCEI (Yup, up 20% and I sold that one too) ,
Hi Alex,
Like CJES,….. SGY got hammered around earnings…they are bouncing off the lows…but do you think they will just rally to the previous lows ( previous support) from the bottom side and then sell off again…. or could it be an ICL and rally back above pre-earning highs….since oil could rally a bit. Just looking for an exit strategy.
thx
Check up MOS POT AGU – Breaking out of nice bases
I was wondering when they would get going. What’s next Uranium?
Hmm, some nice bases forming there. Maybe so.
Retail recovery? Good looking charts on TGT, JCP, M, WMT, LULU, etc
Notice that they are the more inexpensive stores though. Maybe a sign of change?
An idea I stole from somewhere – a new and improved flag (GLD)
http://stockcharts.com/h-sc/ui?s=GLD&p=D&b=6&g=0&id=p49772095629&a=447122699
Ha- Drew this last night-
I was going to put it in the weekend report, I didnt want anyone to steal it from me for their post today 🙂
But we may have this ..refresh…
.
so it doesn’t matter
I’m still in bear mode – I see it as bearish.
Hope I’m wrong!
hopinng this is just a triangle backtest on USO (hour chart)
Nice comment. So the line in the sand is $1207. At the end of the day it sure looks like GOLD is holding and expanding the flag a bit. GDX and GDXJ are weaker today though. Leading?
Hi Jp ( Sorry for late reply, I wasnt here this weekend)
Using cycles, I have Gold & Miners in different time periods.
For example GOLD bottomed DEC 3, Miners bottomed with a shake out low in Mid January. I think both are due for a rest, but the bullish pattern could Pop before a drop.
It has been a great run for both and they continue yo form bullish patterns. A pullback could be a welcome buying opportunity