Archive for month: September, 2015
I dont always do a Friday report, because the Thursdays report usually also covers what could follow through on Friday. Since Friday is the last trading day of the week, the weekend report covers it all. I wanted to write one today - Just Bcuz.
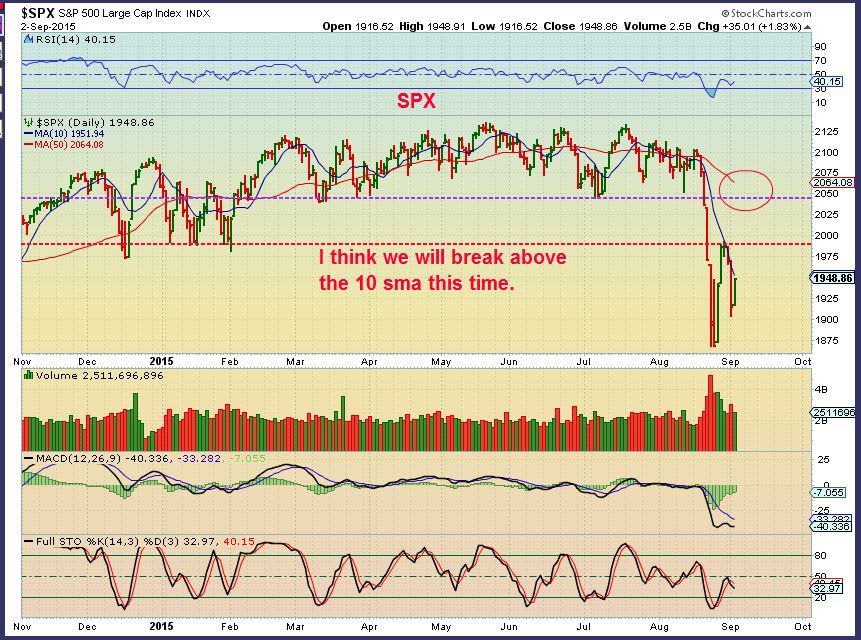
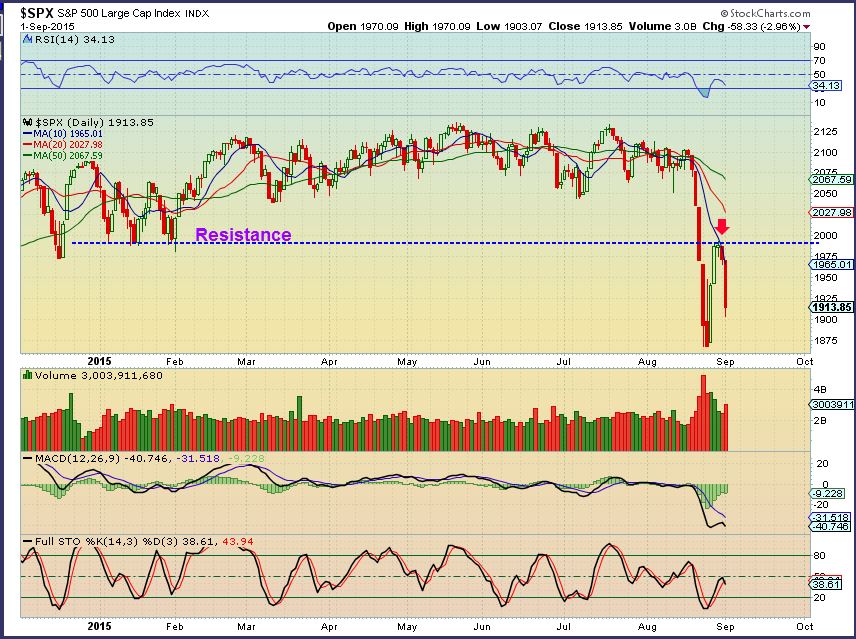
SPX - This could be a consolidation to push higher or could be forming a bear flag.
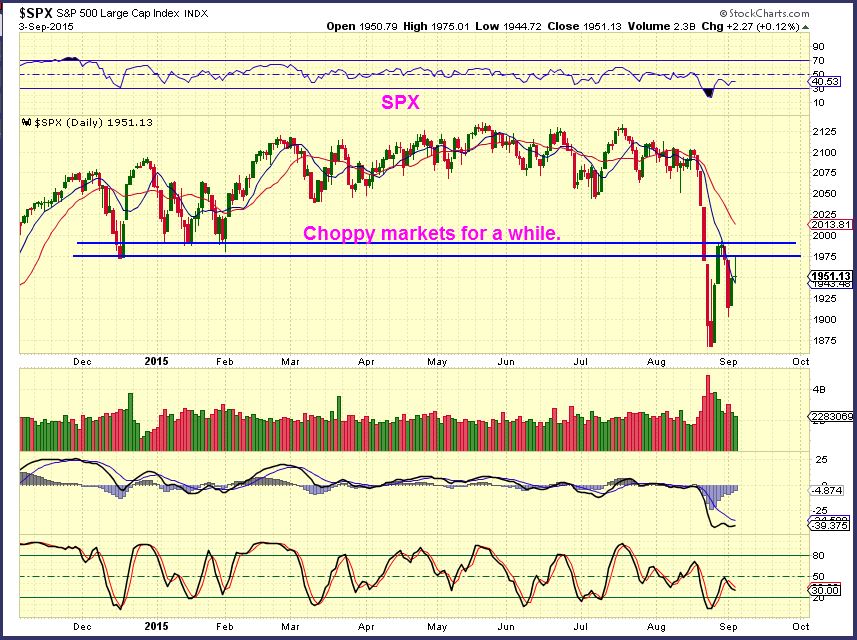
Yesterday it was noted that even when the markets were higher in the morning, the usual suspects were not joining in. That would be F.B., GOOG, AMZN, etc.
Read MoreThe following are a few of the charts I’ve posted in recent Premium section of the website. I believe we may be seeing a major shift in the markets and the recipients of future money flow just may surprise many. Hint: They have been targeted on the short side for many months and in some cases, even years. Here are a few things pointed out in a recent reports.
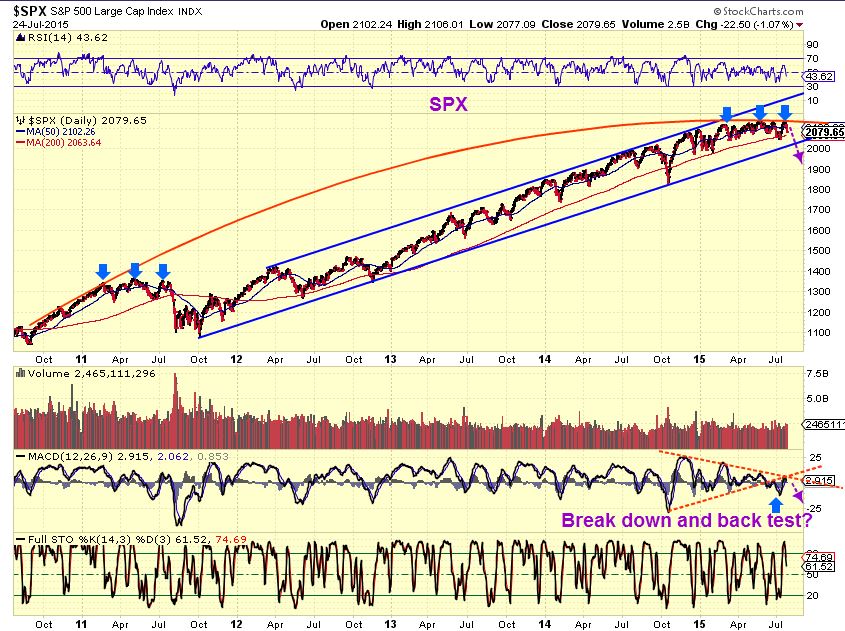
SPX JULY 24 – I have been pointing out a topping process. Watch for a drop.
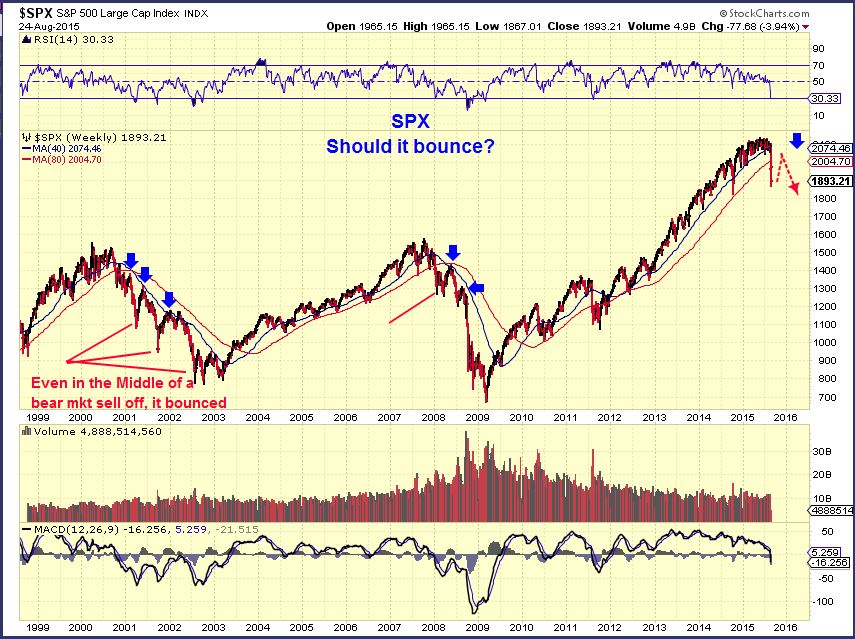
AUG 24– I did not recommend going short after the first drop, it is often better to wait for a bounce. Tops are a process . Look at the tops of the year 2000 & 2007 below. It took months to complete a top and even then, after each drop, a solid bounce can be seen (Blue arrows).
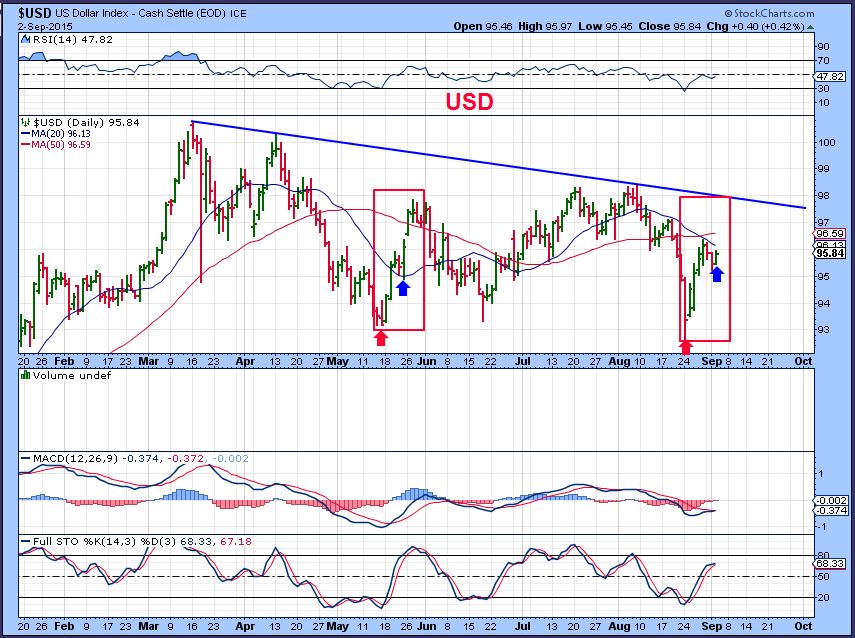
The weekly USD looks pretty strong. We saw a reversal off of the 38.2% Fib line (Amazing, huh?). I have said that I see weakness short term for weeks now . Was that drop all there was to it?
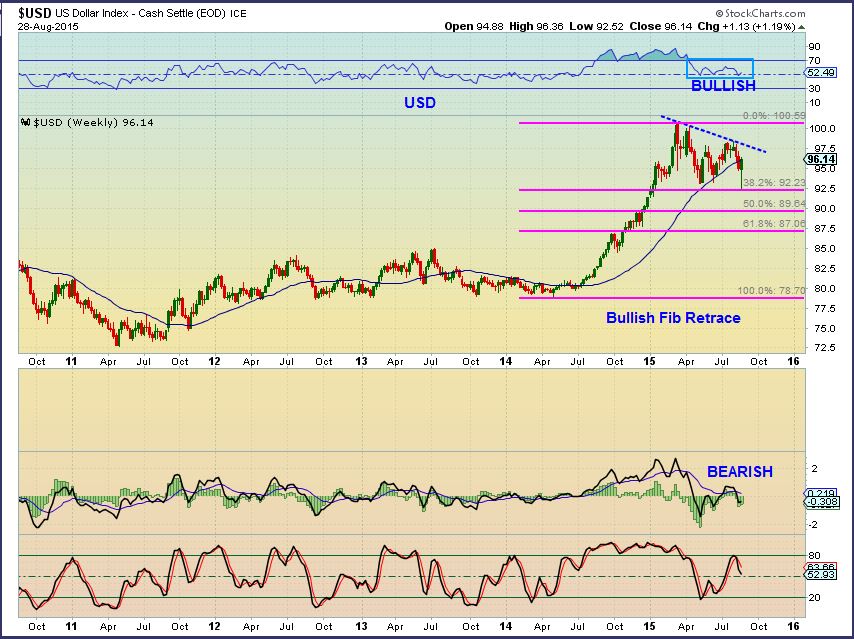
USD DAILY – I actually still see weakness within the rally, just like I saw in the MAY rally that rolled over. We could hot 97 , but I think that would be it for this rally. Commodities are also possibly indicating that the dollars rally is just a bounce.
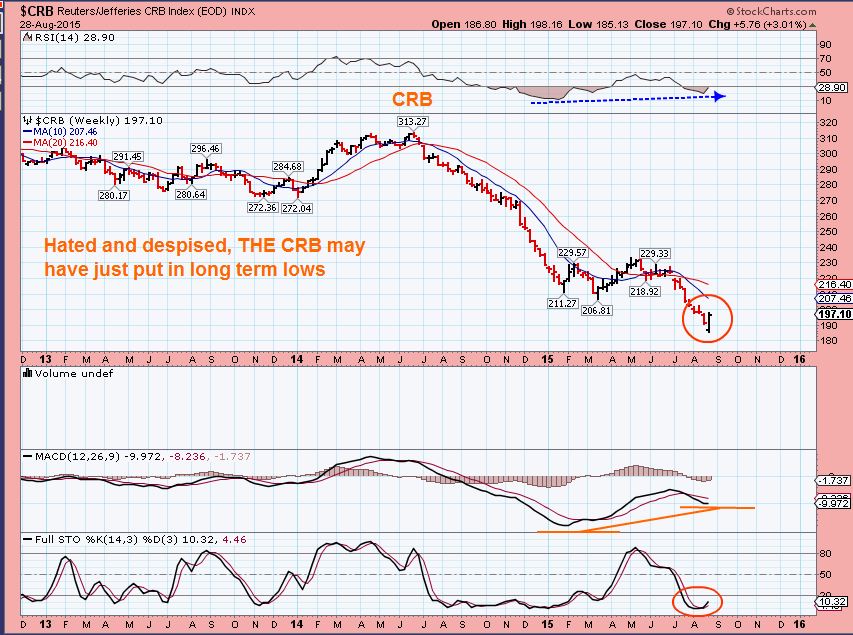
CRB – Rising with the dollar this week. Bullish Engulfing at the lows. Strong divergence on the weekly chart. These lows should hold for several weeks (possibly being THE commodities low).
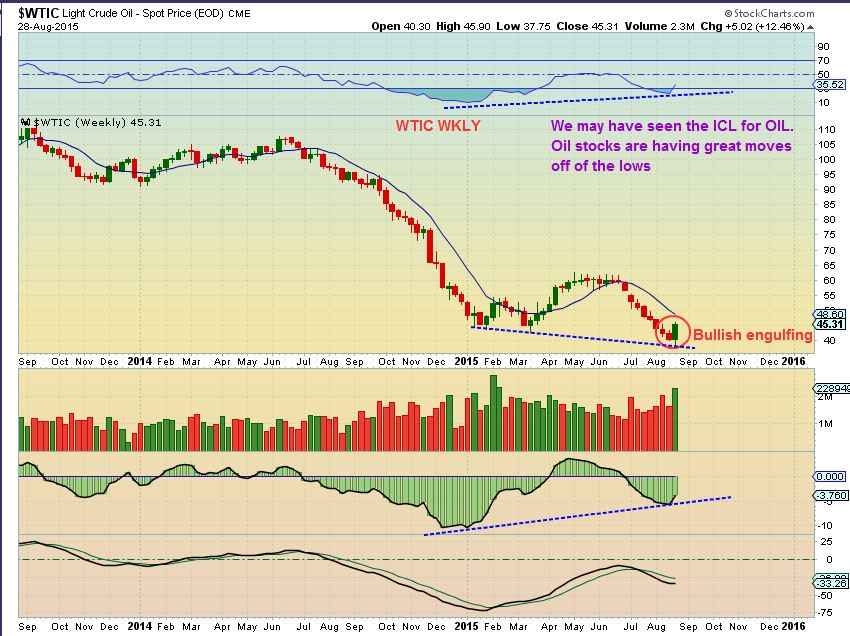
WTIC WKLY – BULLISH Engulfing Candle at the low. Strong buy last week, I.M.O. I see weeks of higher price from this low.
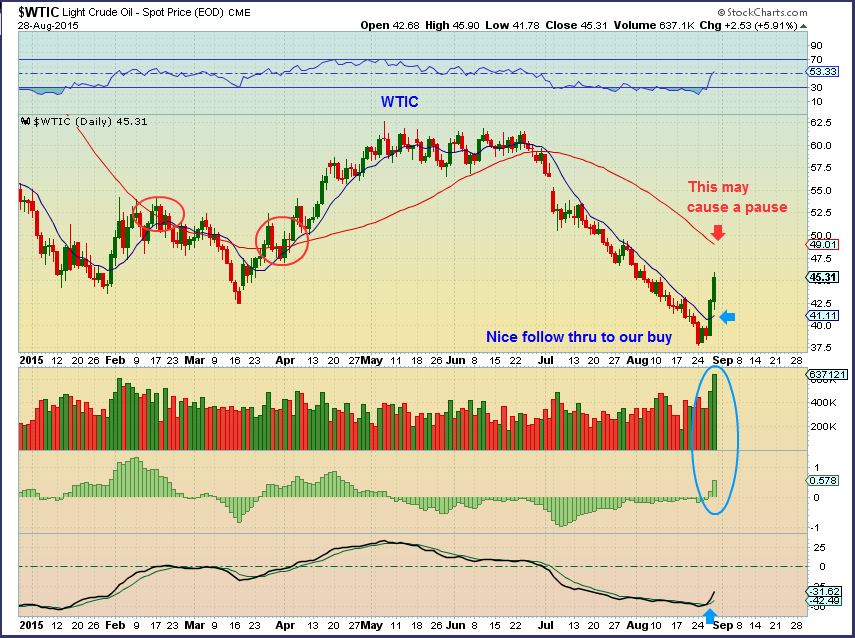
WTIC DAILY – I called Aug 27 the FAT PITCH in my recent report, a ‘buy’ on OIL & ENERGY STOCKS. For oil, the 50sma could cause a temporary pullback, a buying opportunity. That has happened this week. Soon we should move generally higher for weeks.
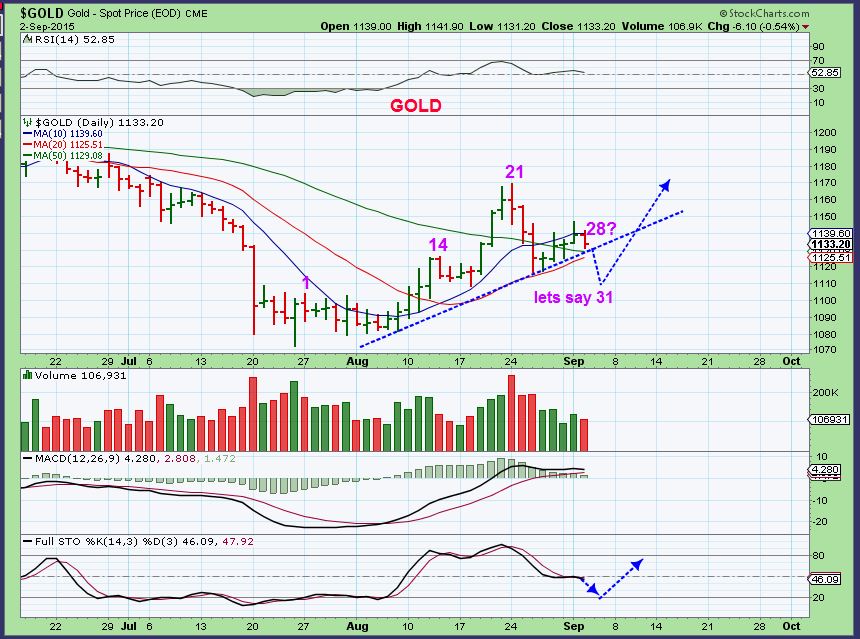
GOLD,SILVER, & MINERS
This is the Gold charts cycle count. On day 28 it is due for a daily cycle low anytime now. Even a drop to $1109 does not damage the chart. We should then rally higher.
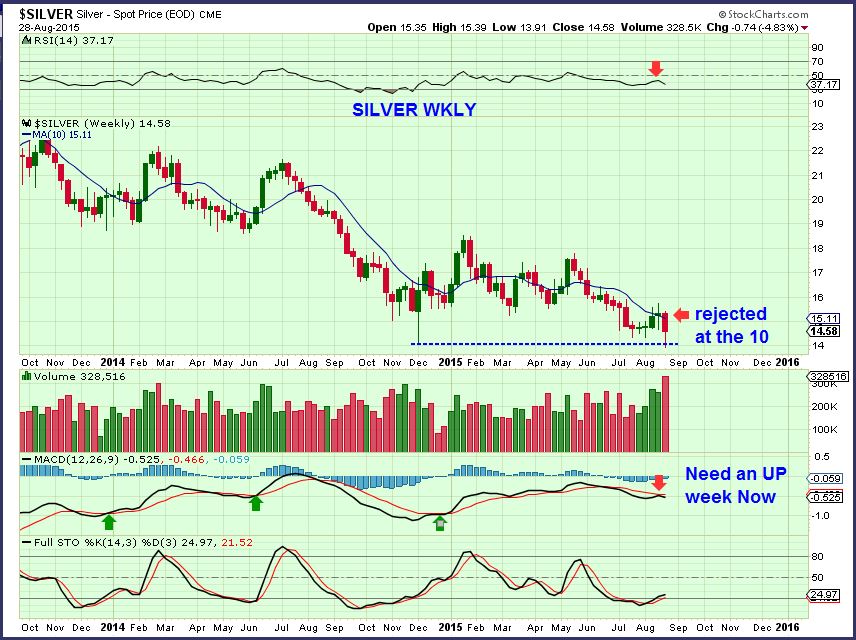
Silver weekly – It is a bullish reversal of sorts. It could be a high volume capitulation type stop run, that would be great. We need further improvement this week. I am watching this carefully.
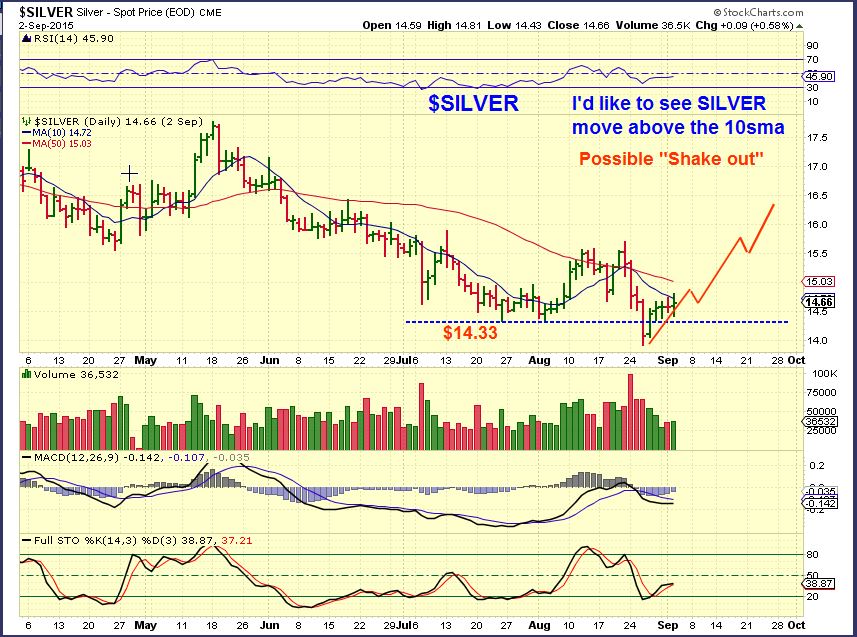
SILVER DAILY – Sept 2 , A Shake out may have taken place and so far we are moving higher.
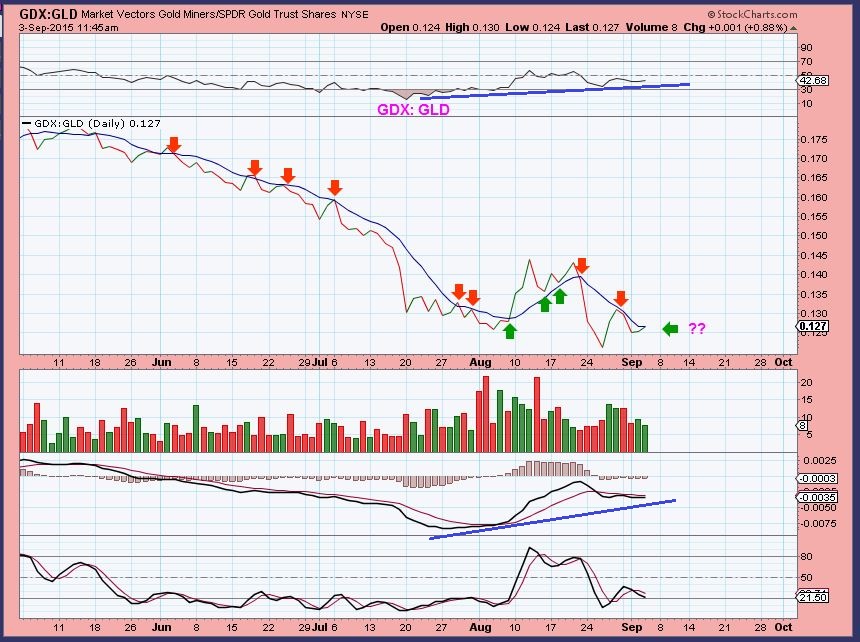
GDX – We see a struggle at the 10sma, but I expect that we will break & close above it soo
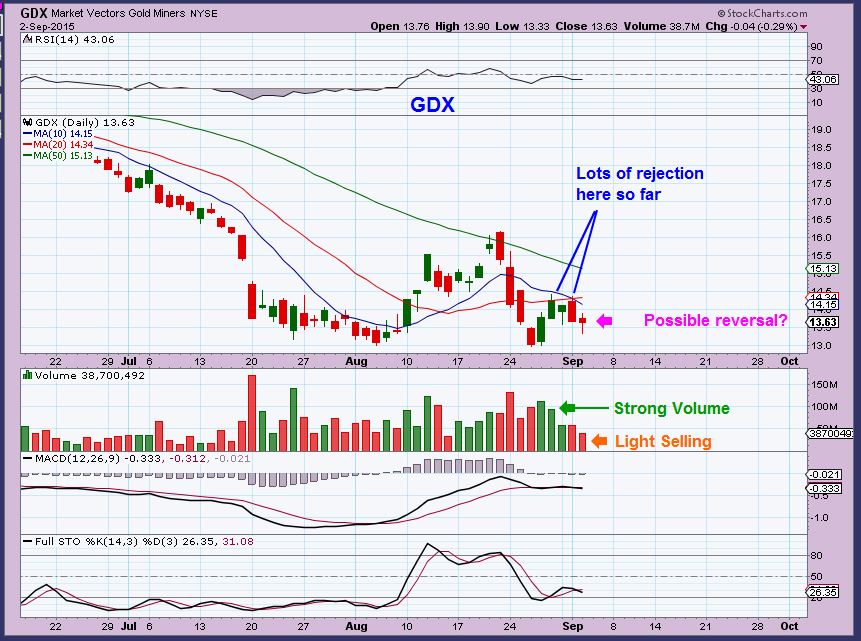
GDX:GLD is heading in the right direction. Another buy soon if miners continue to out perform.
Conclusion:
SO I am cautious about what is happening in the broad markets. We are seeing a bounce higher, but buyers may get washed out soon. These are volatile markets and we may be setting up a longer term short.
I like what I see on the weekly charts with GOLD, SILVER, MINERS, The CRB ,OIL, & ENERGY STOCKS. They have recently turned bullish. I mentioned in past reports the bullish set ups developing in ACI, BTU, AKS, BOOM, X, FCX, VALE, MDR . With OIL AND ENERGY I also pointed out many that are also moving nicely higher. Some energy stocks are up 100% already.
Here at Chartfreak I am watching the various set ups and offering opportunities to buy the pullbacks at low risk entries. I will include a few of the charts that I used in recent reports. For a low monthly or quarterly price, you can get reports like the above report 4 or 5 times a week. Thanks for being here.
~ALEX
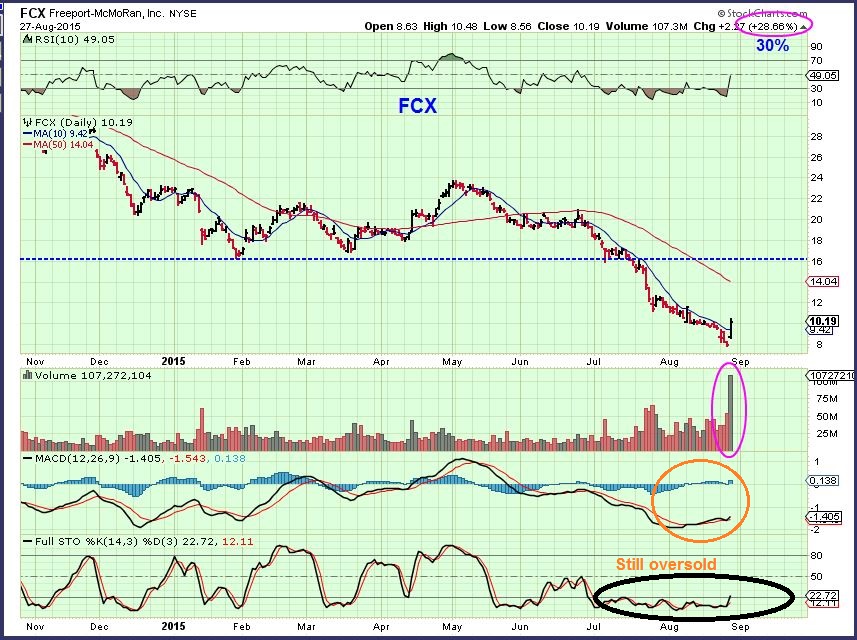
FCX – Buy the reversal. Strong volume and above the 10sma.
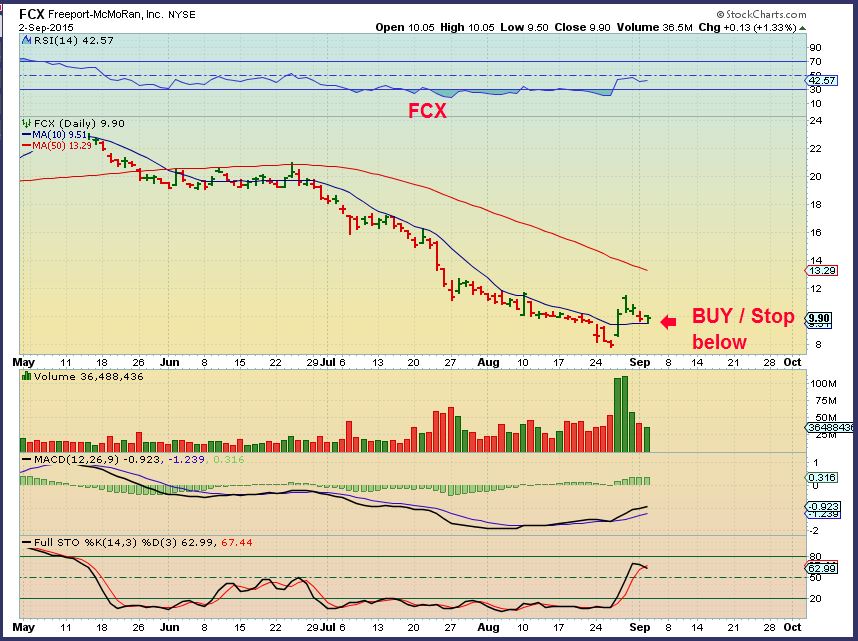
FCX – Low risk entry, stop below the support.
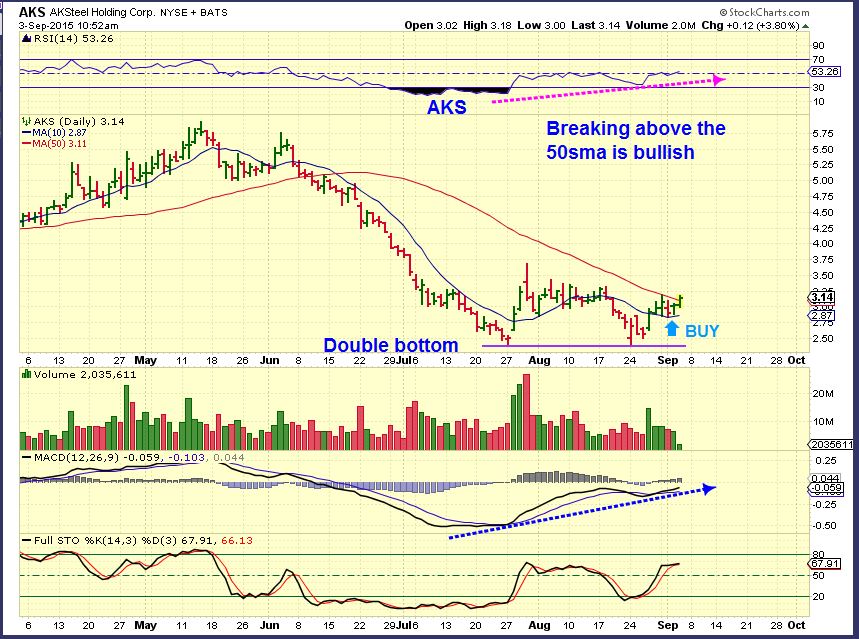
AKS – Low risk buy of a double bottom.
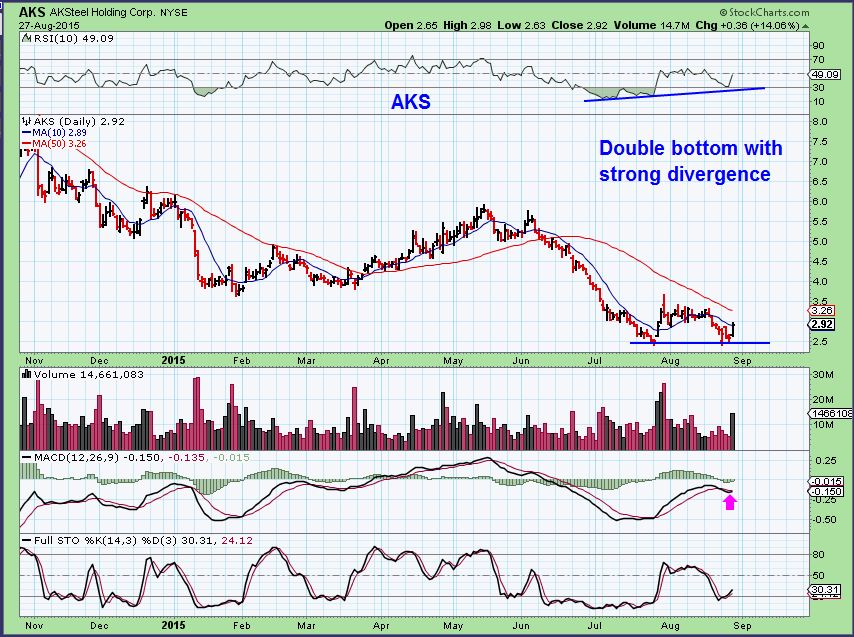
AKS today – This is still a good set up, support held.
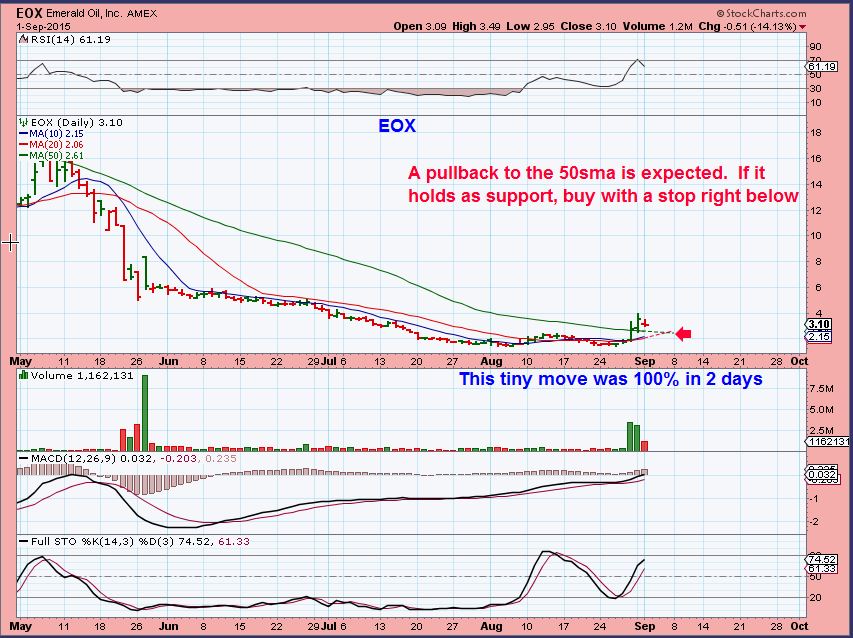
EOX – Sept 1 , this stock is spit adjusted, but it popped almost 100% in 2 days.
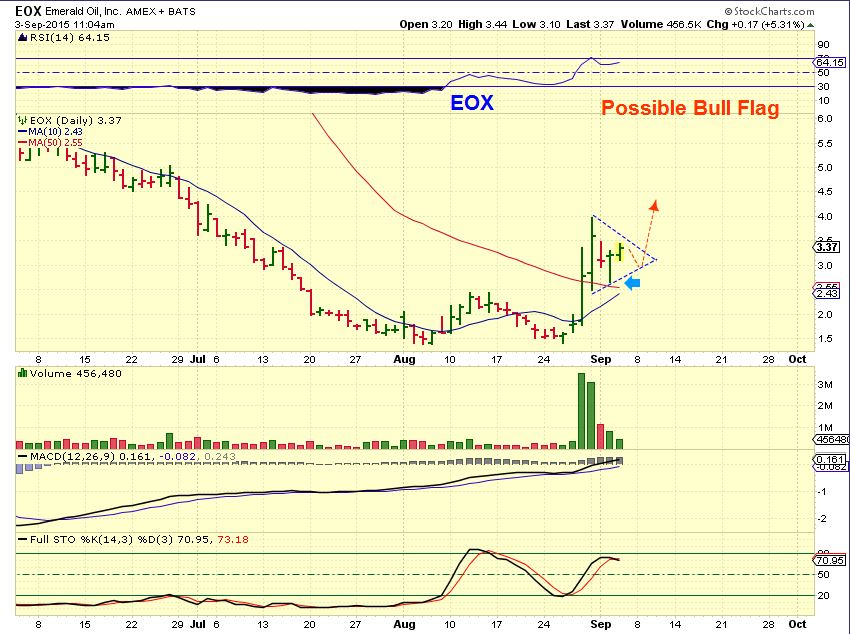
EOX Currently – possible bull flag forming or just a move higher.
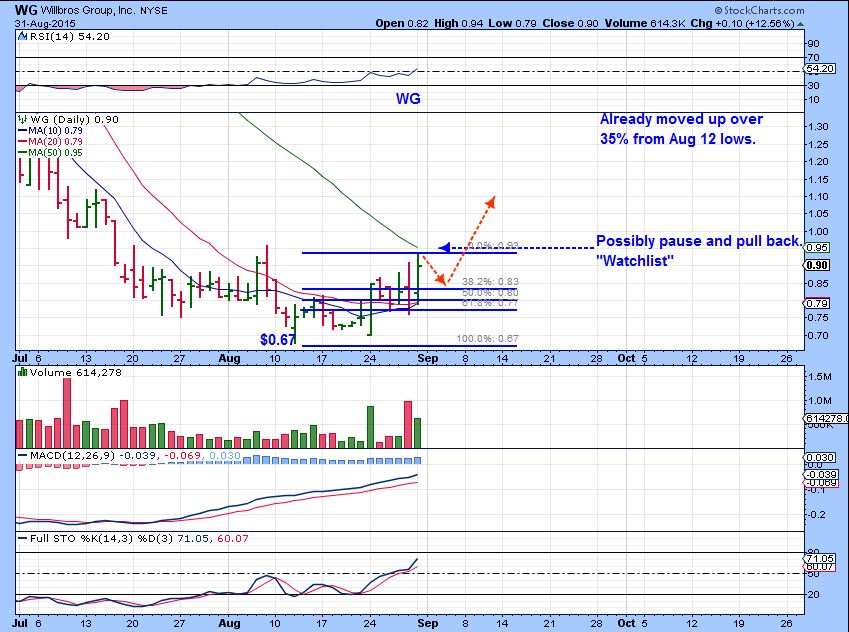
WG– Some Energy stocks trading under $1 have formed long bases. I liked this set up.
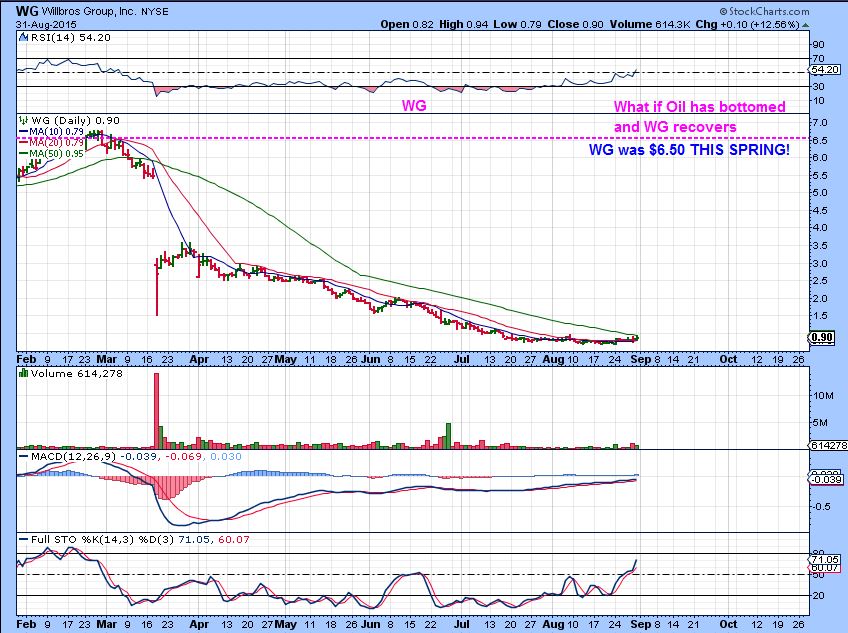
WG– Trading at only $0.90 , it was showing signs of life, already up 35%
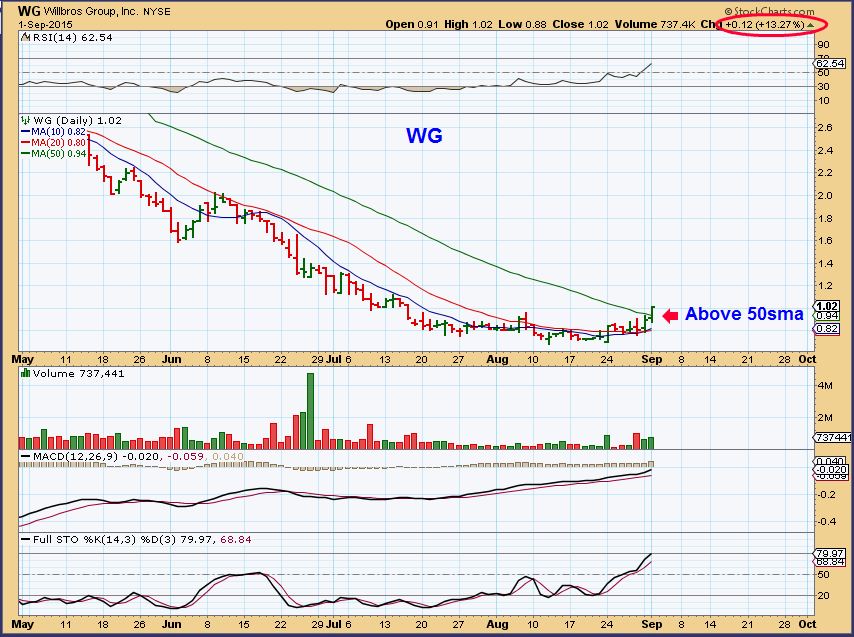
WG– Then it popped above the 50sma, even better.
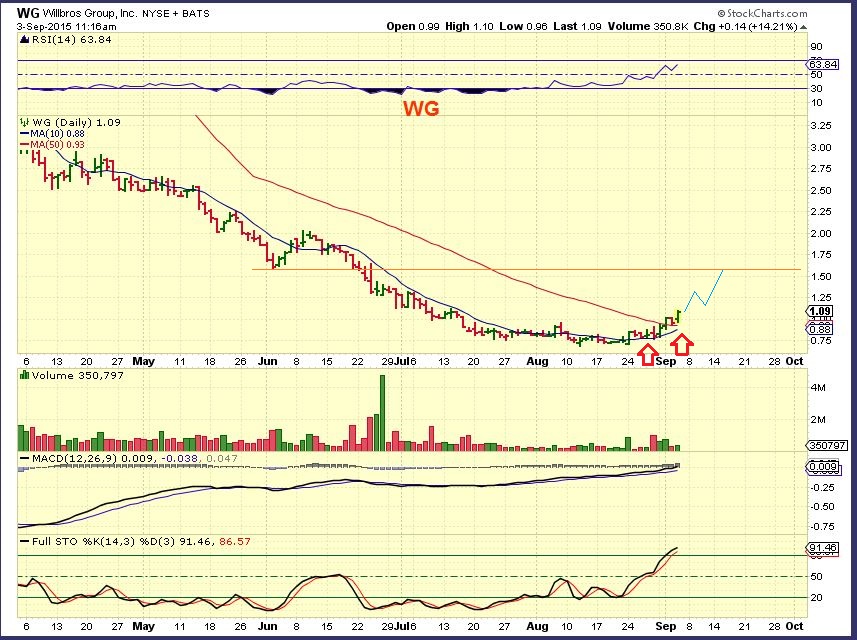
WG – Still moving higher. So far 20% higher from that $0.90 mark .
Many times we hear about buying the pullback, but when the pullback comes, it may be too intimidating to pull the trigger. Did you do any buying yesterday? Lets review the market action and also discuss "Pulling The Trigger".
.
SPX - The Spx has turned back down at resistance and has been rejected at the 10sma too. Wednesday the markets reversed back up to the 10 sma. This time it may be able to push higher.
 Read More
It felt like just about everything in the market was pulling back today. Not all pullbacks will qualify as a 'Buy the dip" candidate, but some may be setting up as a nice opportunity. Lets take a look...
.
SPX - This turned down at multiple resistance areas.
 Read More
This report will be a report on the statistics of what was reported on in the weekend report...
Read More
Scroll to top