Archive for month: February, 2015
The website went down and my apologies for this report being released a little late, thank you for your patience! I had so much to cover, so I am going to try to write less and allow the charts to speak for themselves, feel free to ask questions in the comments section if you need my help...I will be available on & off today. To the charts...
QQQ - Same ole same ole.
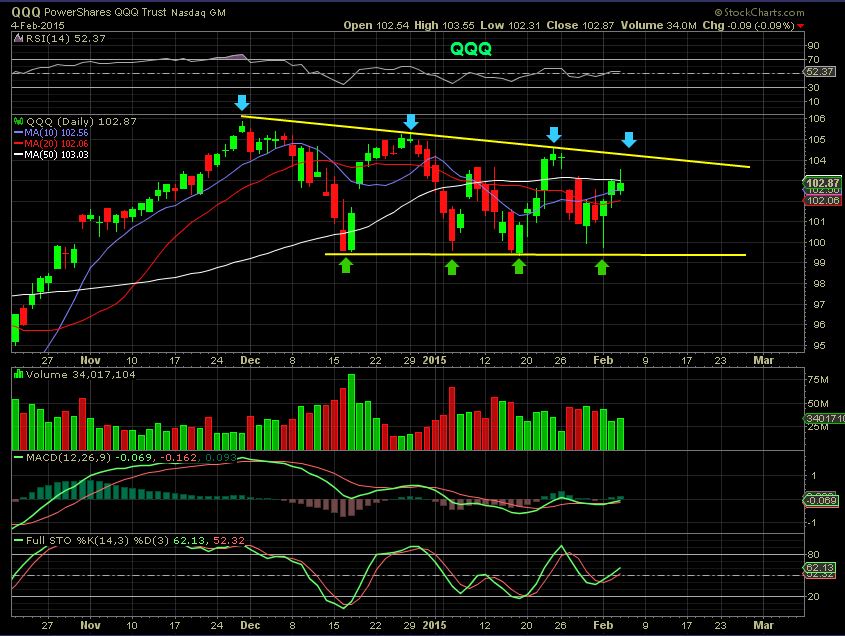
I had been shorting the top ( adding TZA) and closing half at the lows, also watching the 50sma. I closed out this position , but may add if we reverse & drop lower again. It is still unclear which way this will eventually break, here is why...
Read MoreThe following is a portion of a ' Premium Report' put out Monday Jan 26. This is only 1/2 of the report, but should be helpful . To be honest, I initially only made small profits on some of these trades at first. I had to leave town after the New England Storm , and since positions are volatile at the lows , I cashed out & re-entered later when I could monitor them. I 've added a few updated charts too. Enjoy
JAN 26 ,2015
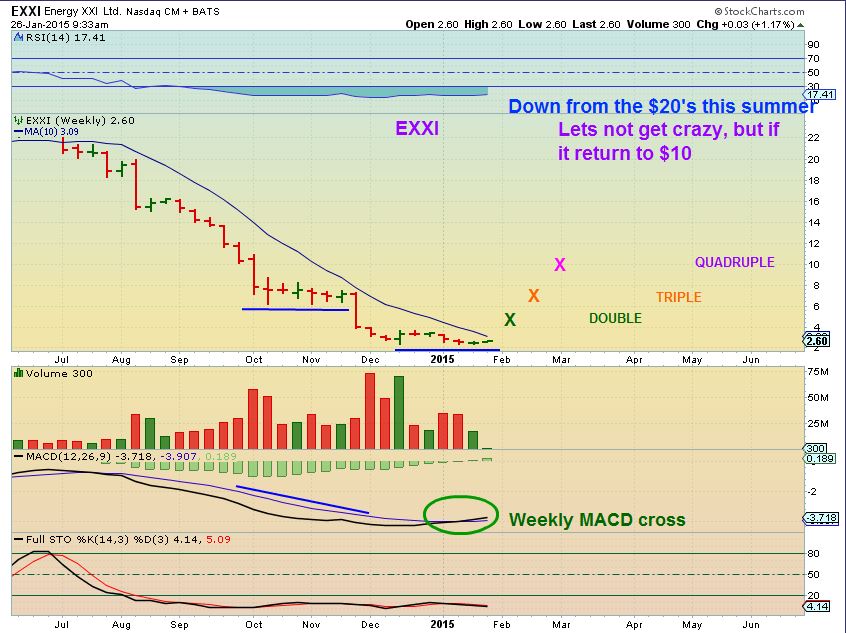
Let me start by showing you an Energy stock that got taken out to the whipping post. It is beaten down and has double bottomed. It seems like all of the downside ( At least for now) has been met. Risk reward is skewed toward less risk (Using stops) and more upside potential if conditions play out. Some of these stocks could just "Bounce" and do very well.
EXXI WEEKLY - Double bottom with a MACD cross? $2.60
Read MoreI have a lot to cover, so lets just do a quick review and on to the charts...
SPX - as the consolidation continues it goes from looking weak to looking more bullish
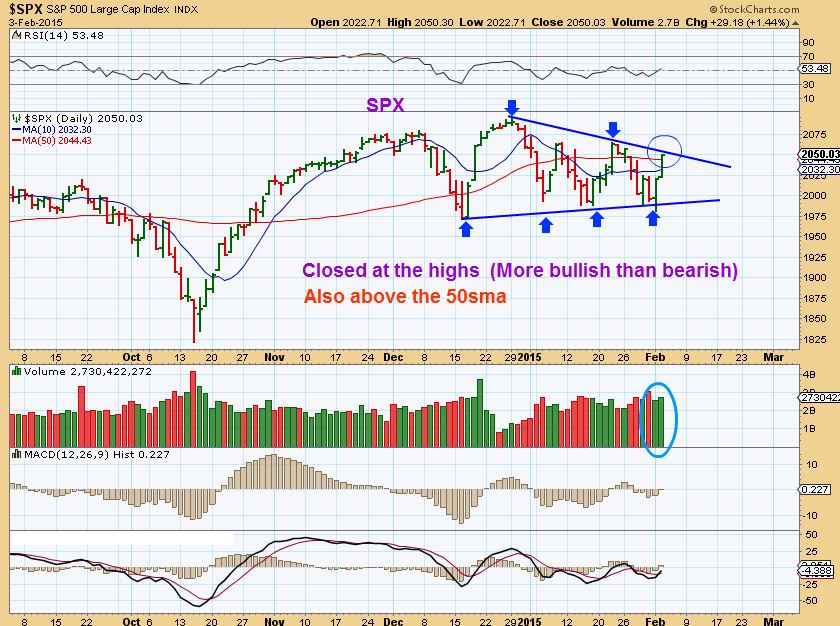
In prior posts I wrote that...
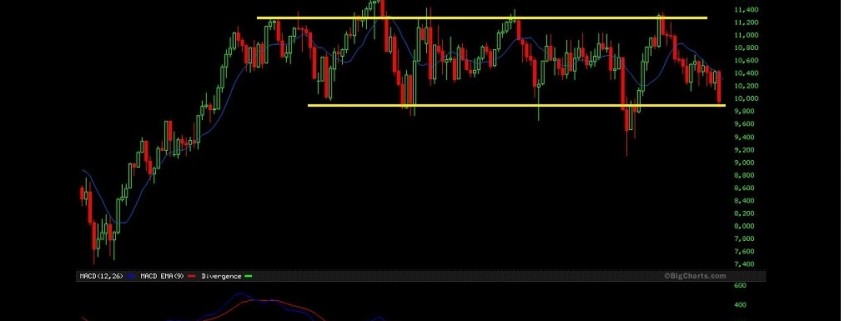
Read MoreAnswer: Frustrating ! Actually its an example of a trading range. Often after a stock or index Price has run higher , you get a sideways consolidation that is called a trading range. They can form as flags, wedges, channels, etc. It can be a trading opportunity on one hand, buy the lows & sell the top/ flip and short the top , ride down to the lows. If you aren't an active trader, however, and you are just waiting for some directional move, a nice trend to ride? It can be a little frustrating. Its tough to tell which way it will break, and the chart above actually looks like it may break higher. The chart below is the end result of the chart above.
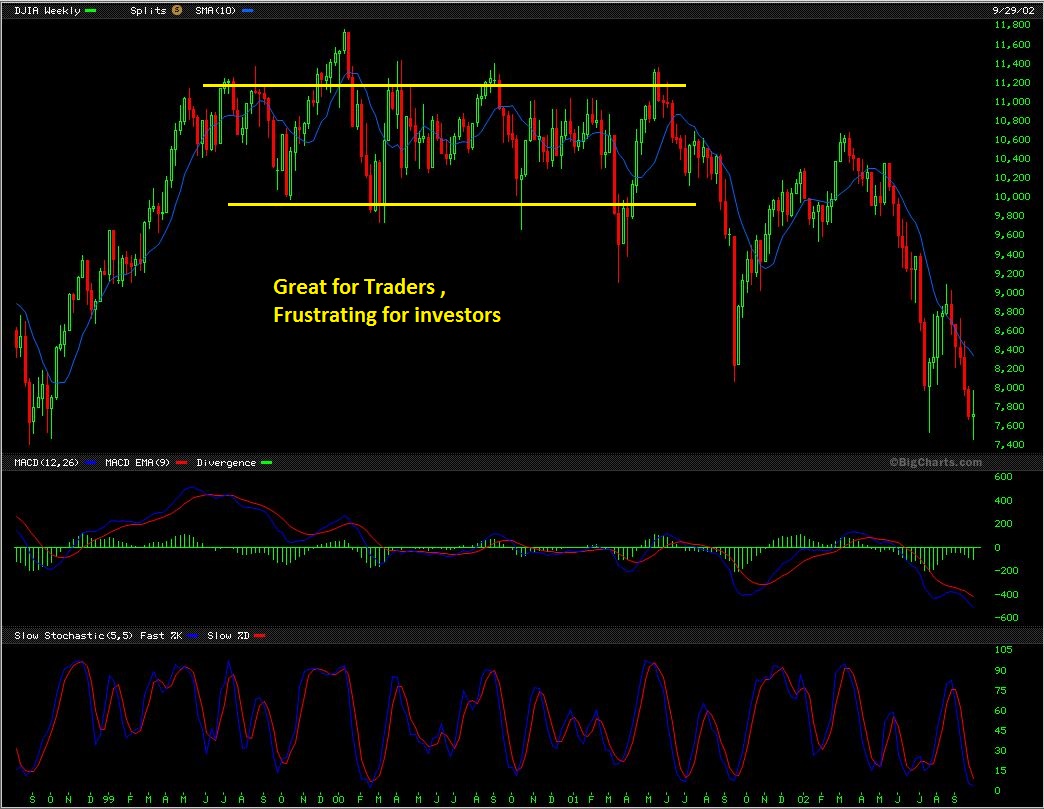
The reason that I bring this up is because our markets are currently in a consolidation too...
Read More
Scroll to top