You are here: Home1 / Public
https://chartfreak.com/wp-content/uploads/sites/18/2022/11/FED-DAY1.png
816
476
Alex - Chart Freak
https://www.chartfreak.com/wp-content/uploads/sites/18/2019/11/Chart-Freak-site-logo.png
Alex - Chart Freak2023-03-22 11:32:042023-03-22 11:32:04Wednesday March 22, 2023 : F.O.M.CI have decided to post the weekend report to the public section of the website. Here at Chartfreak we have been mainly long Miners for several weeks weeks and shorting the bounces in the General Markets using SQQQ and SOXS. Using cycle timing, I have been expecting a pullback in the Precious Metals sector for the week of the Fed, so this is the weekend report leading us into that Fed Mtg on Wednesday March 16th. Enjoy!
.
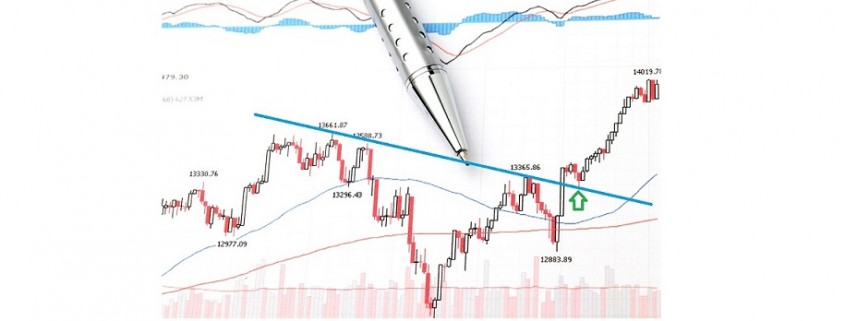
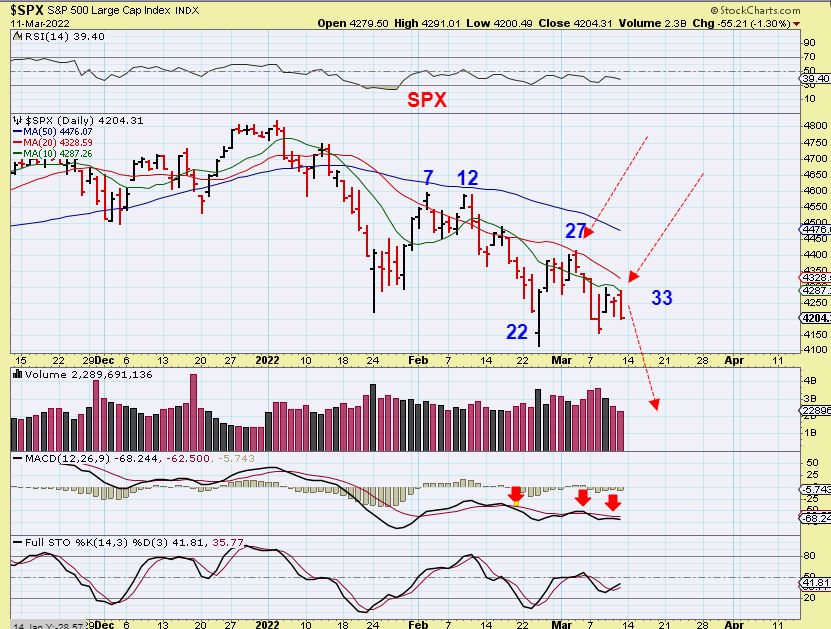
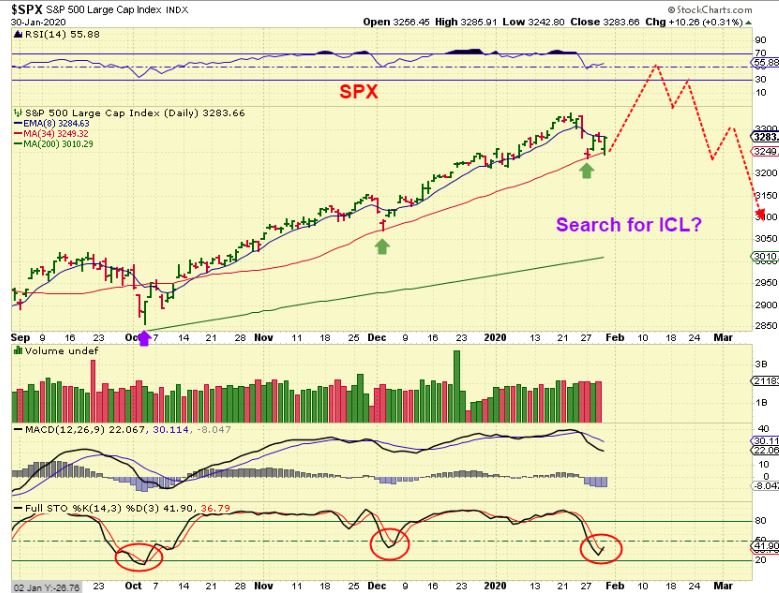
SPX DAILY – Friday was day 33 and after a gap open higher, price was rejected at the 10sma and sold off and closed near the day 33 lows. I have been expecting the day 22 lows to be broken and that should happen next week. These daily cycles can last for more than 40 days. Next week is a Fed Week.
SPX WEEKLY – We have seen a very strong bull market, but at this time we expected this market to break down and now we see the strong support of the weekly charts has been broken and price sold off below it. The General markets are dropping down into an ICL over time.
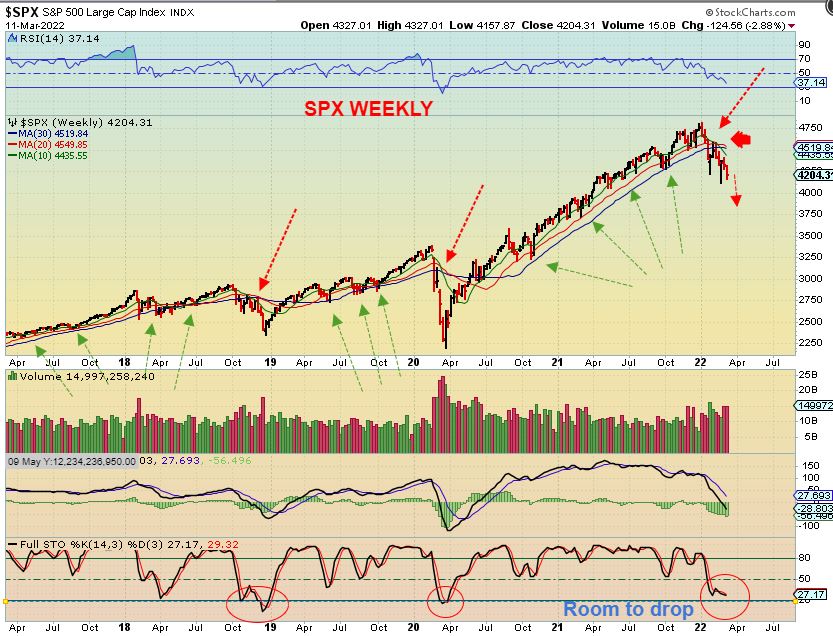
The General Markets had failed daily cycles , as pointed out in past reports, so they are dropping lower over time until they find their ICL. Is the next swing low going to be just a DCL or will it also be the next ICL? We’ll know only after it forms. For now I expect a market drop into the next Daily Cycle Low.
LAST WEEK I USED THE FOLLOWING 3 CHARTS AFTER MARCH 9 TO EXPLAIN OILS SET UP:
.
WTIC DAILY – Oil had an usually Sharp 1 day drop on March 9th and that MIGHT be putting in place a day 10 top for this daily cycle. If so this would become a left translated daily cycle.
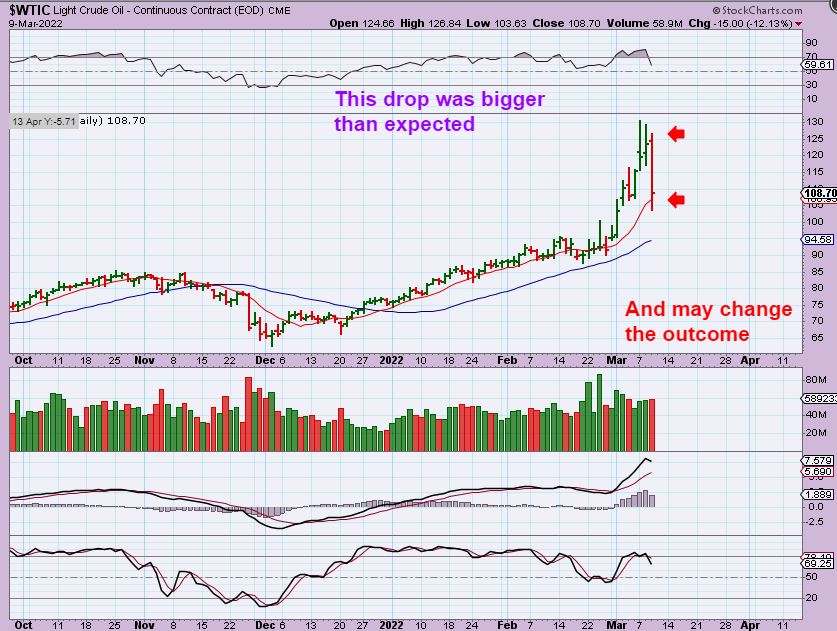
WTIC DAILY – So we will be watching Oils path from here to see if a bounce can make new highs or to see if this is possibly topping with a lower high. Previously I had been looking at a $140+ Price target before that sudden surge and drop, but this might mean that the top is in for now. Price dropped from $130+ to $103 in 2 days.
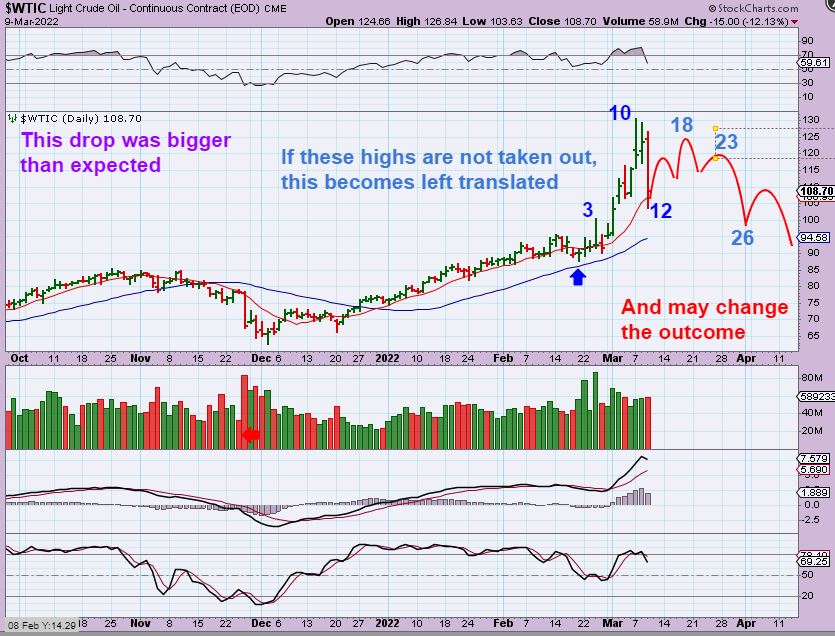
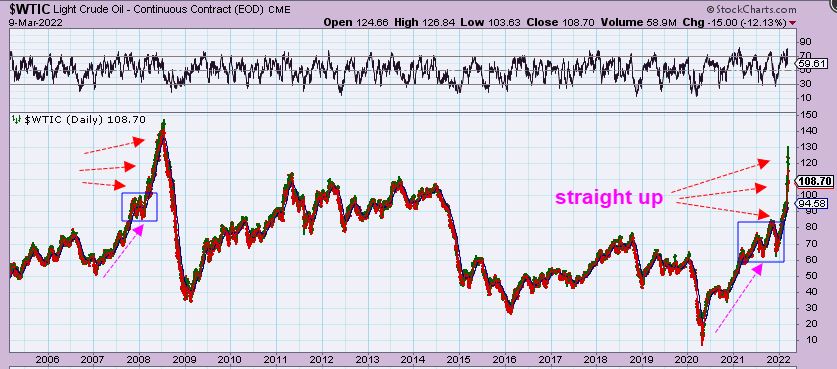
WTIC DAILY -I pointed out the speed and straight up move as a possible parabolic blow off top. If day 10 is not exceeded, this is indicating that Oil has exhausted the move, but we’ll need time to see how this plays out. You can be long Oil with a stop, since it is still early in Oils daily cycle, but it may get choppy.
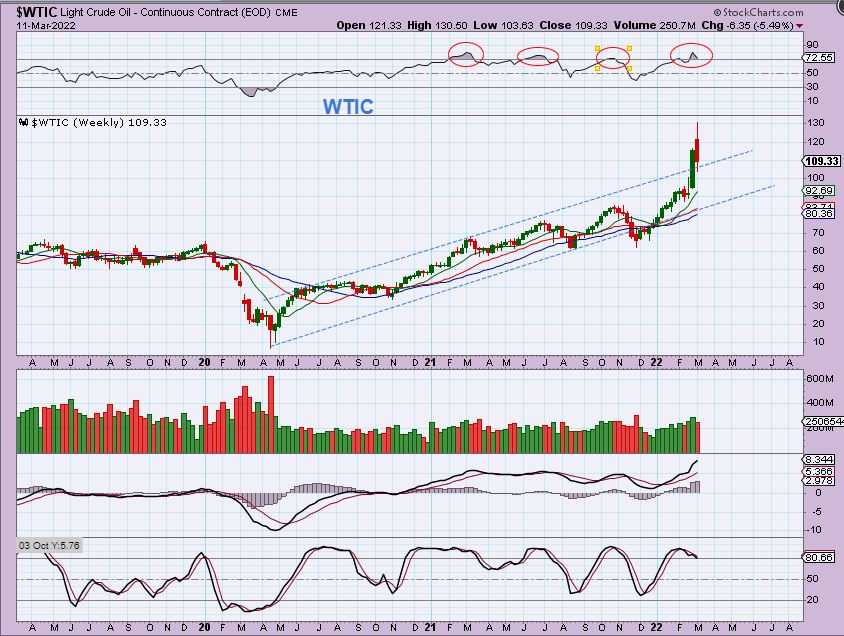
WTIC WEEKLY – 2 trading days later we got a large weekly doji (Indecision), but that was really expected, since it is only day 14 and Oil can trade for 40+ days. We just have to see what happens over the next few weeks ( and I think that more volatility can be expected with the war going on). Passing time may reveal that this is a false break out.
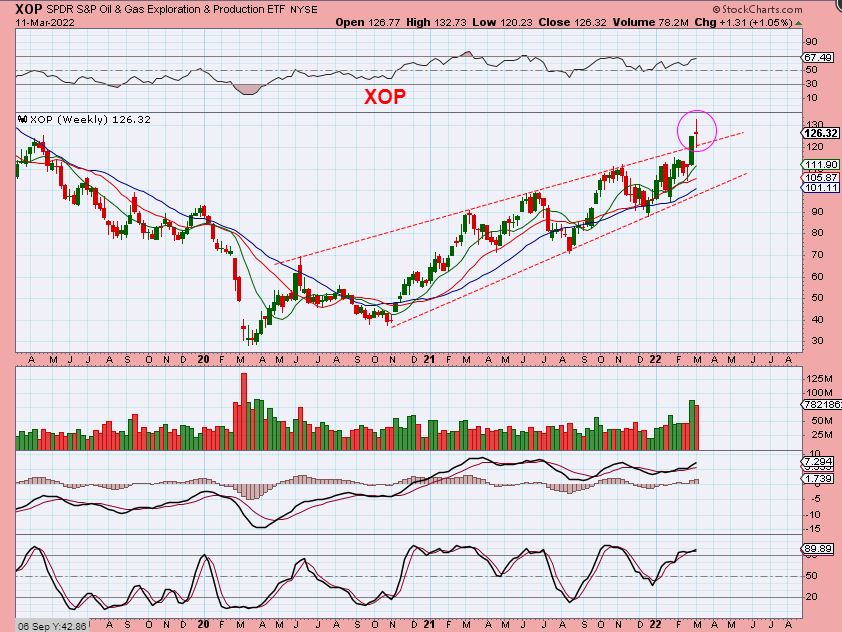
XOP WEEKLY – The XOP also broke out, but Oil stocks did not get as extended as Oil and even if Oil just chops around in the $100-$130 area, Oil stocks may still rise.
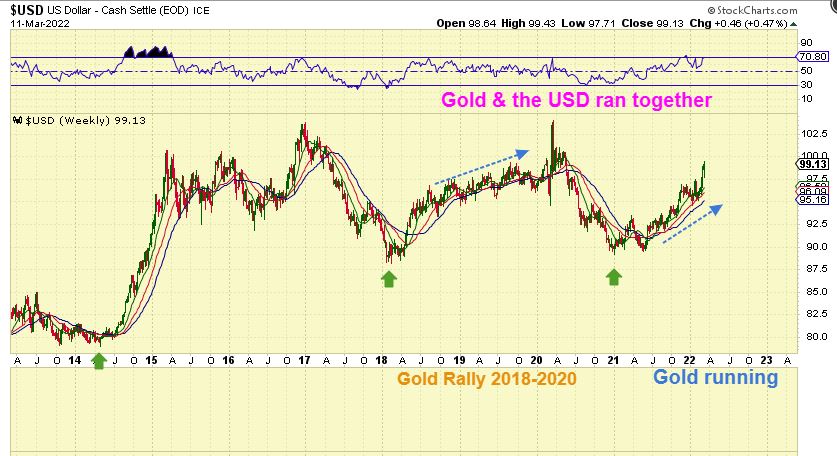
USD WEEKLY – The only thing that I want to point out here is that what I had been saying for a year is playing out. I was pointing out that in 2018-2020, The USD & GOLD both ran higher together, so I said that if it happened then, it can happen again. It has been happening again. With this run in the USD late 2021-now, Gold ran from the lows of that large Cups ‘handle’, back up to the highs.
.
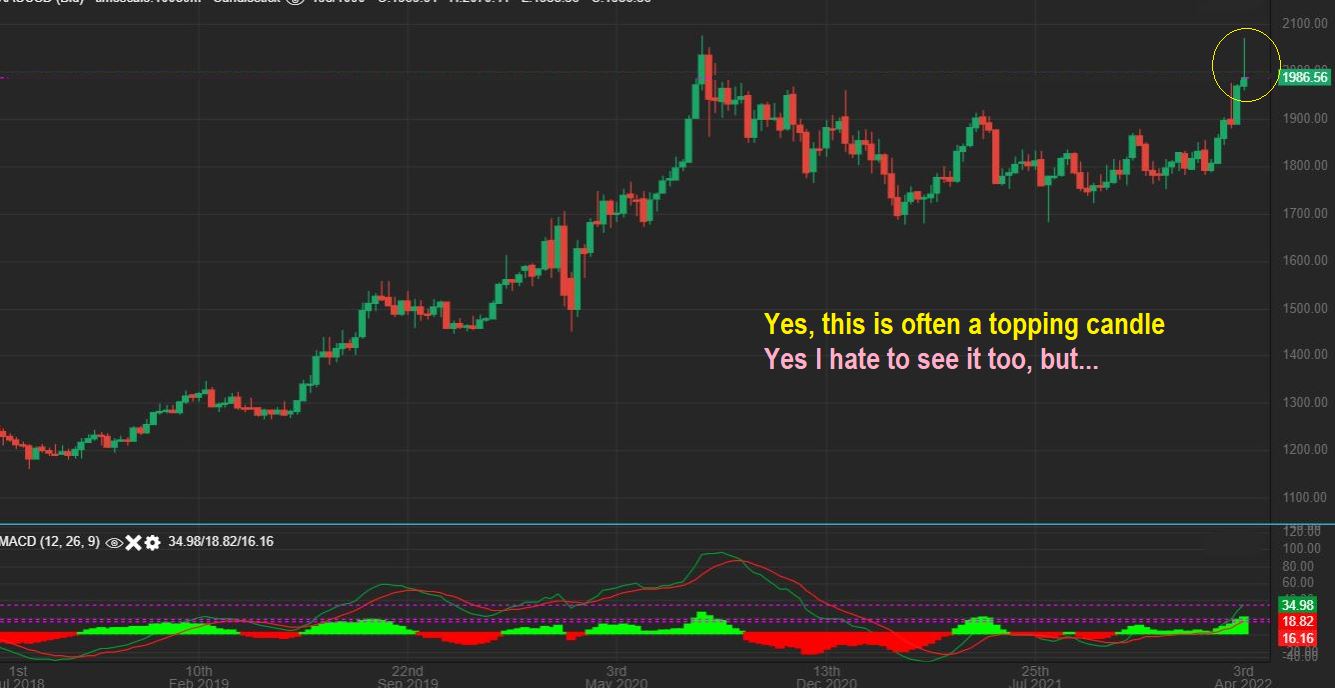
In the past I have shown this topping candle – ‘The Shooting Star‘.

.
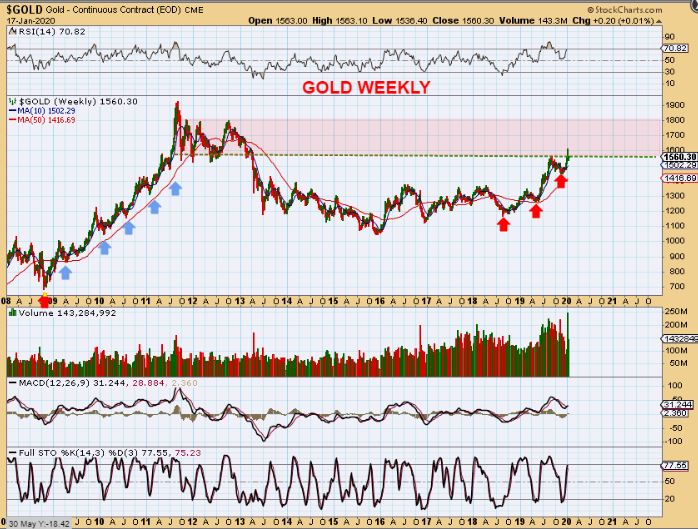
GOLD WEEKLY – I hate to see what is usually a “topping Candle”. These usually do come at the top of a run as an exhaustion of buying & profit taking, but let’s discuss this just a little more.
.
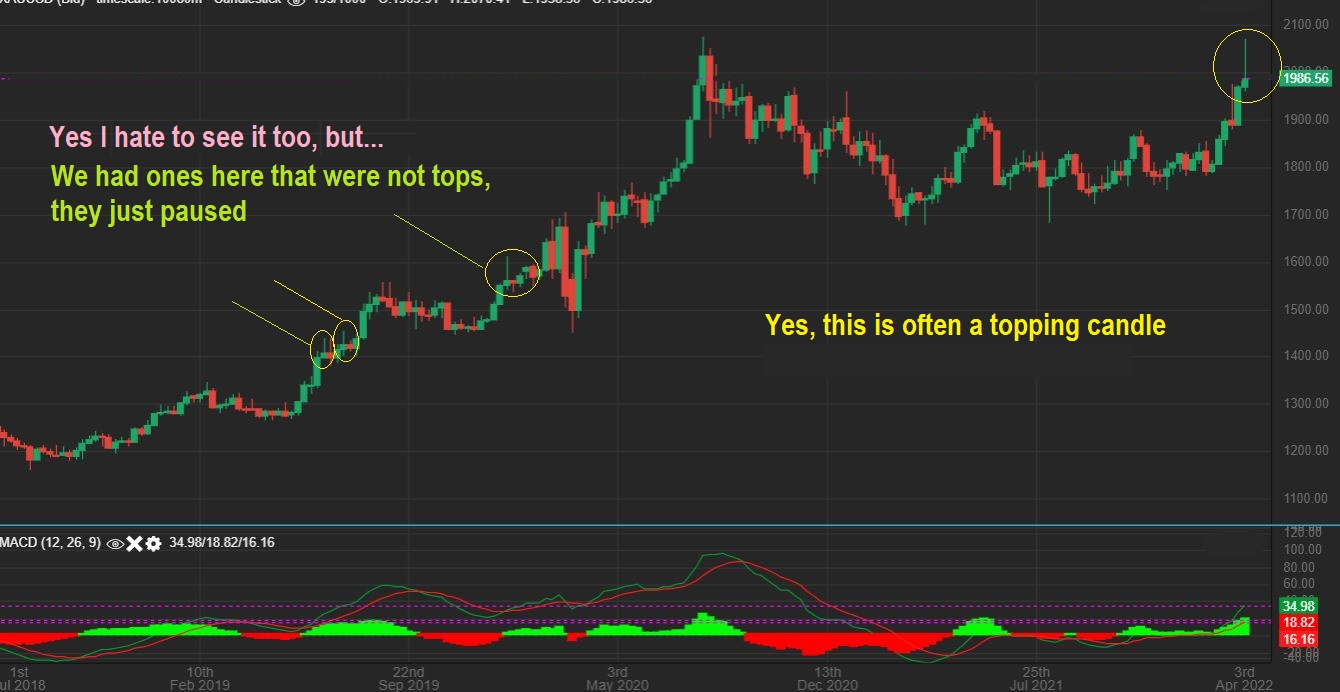
GOLD WEEKLY – I have seen in the past when these shooting stars did show up after profit taking, as seen on this chart, but then paused and continued higher. This is how I am looking at this chart…
1. Each of these circled shooting stars had 1 red week that followed and then they went higher.
2. The current daily cycle is on day 30, so a dip into a dcl is due next week.
2. Next week is a Fed week. Please be mentally ready for a dip, I have been calling for that for weeks.
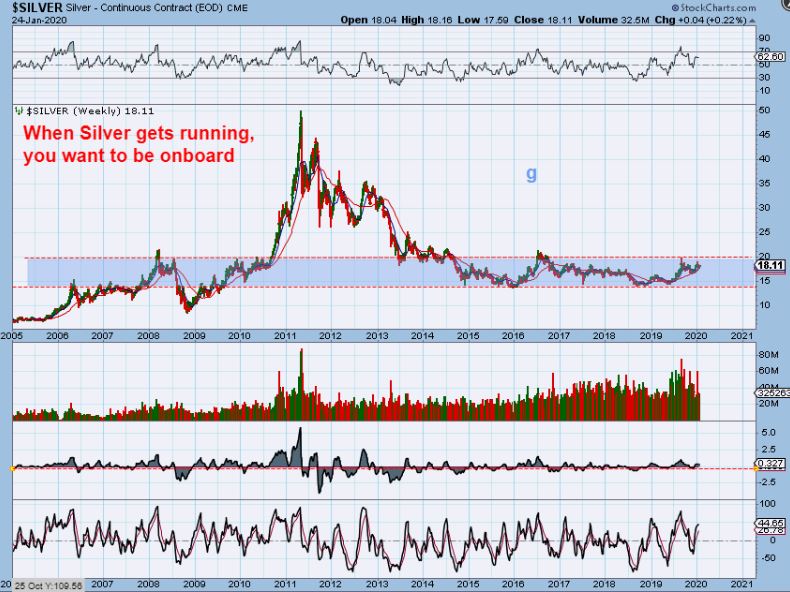
SILVER WEEKLY – This was a the strong break out from the downtrend that I was hoping for, but now we have a shooting star here too. My discussion about this with Gold applies here too.
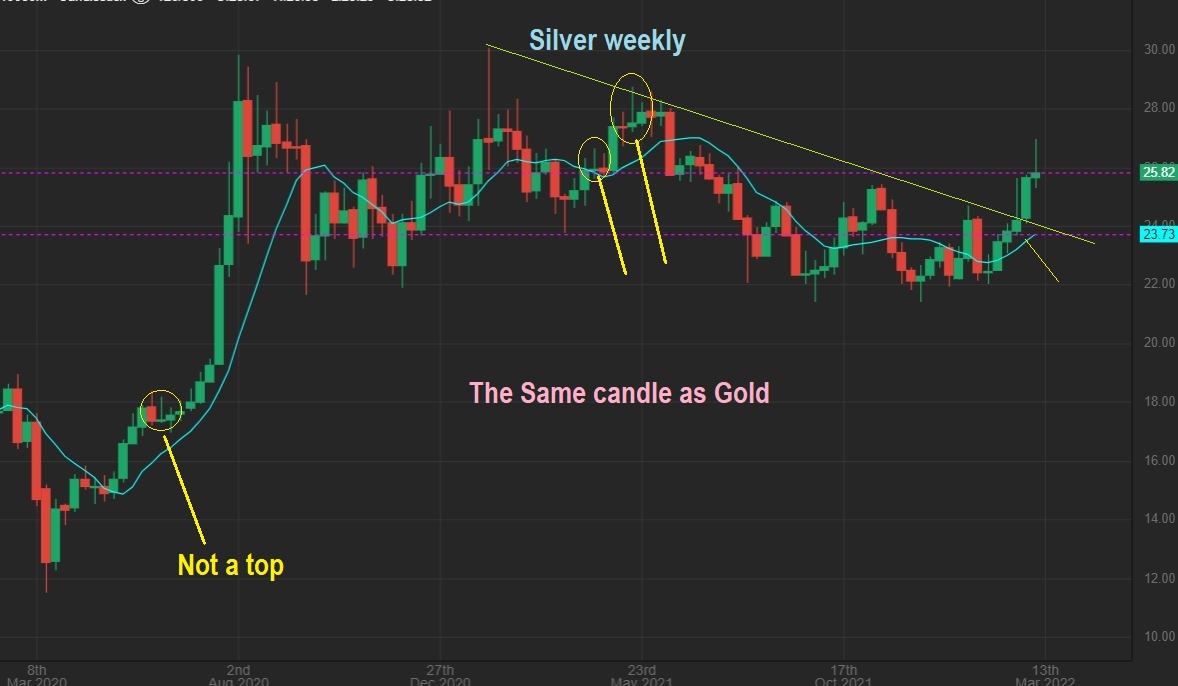
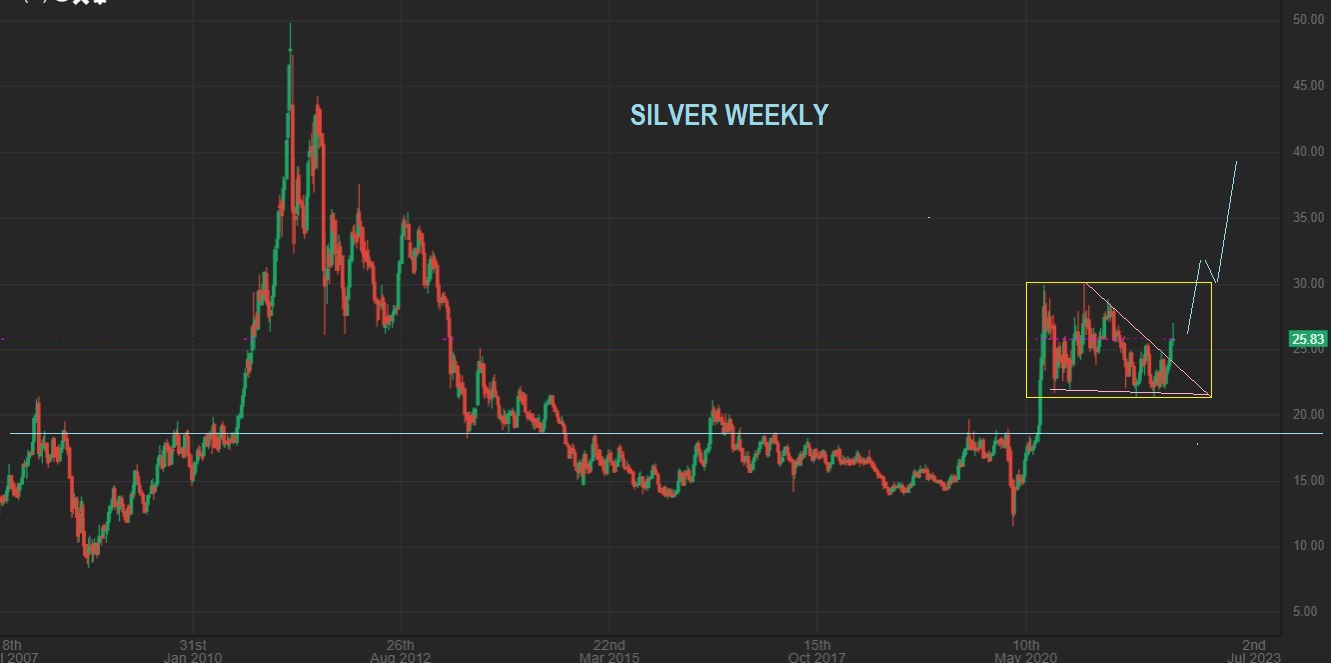
IN THE BIG PICTURE SILVER WEEKLY, I was pointing out that we needed a break out from that downtrend and then price could rocket higher, since Silver often moves very quickly. I think Silver will continue higher after we get a dip next week.
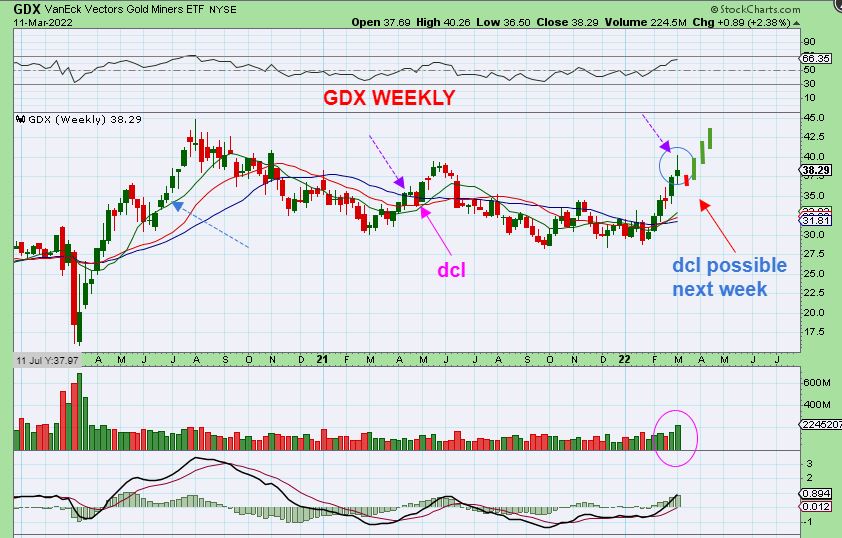
GDX WEEKLY– Miners have raced higher over the past few weeks as expected too. For the past few weeks all were admonished to buy and hold a basket of Miners ( or ETF) and ride this blast higher. We did this in past strong rallies like 2016, 2019, 2020, and I mentioned that those who were afraid to buy got left behind. Next chart please…
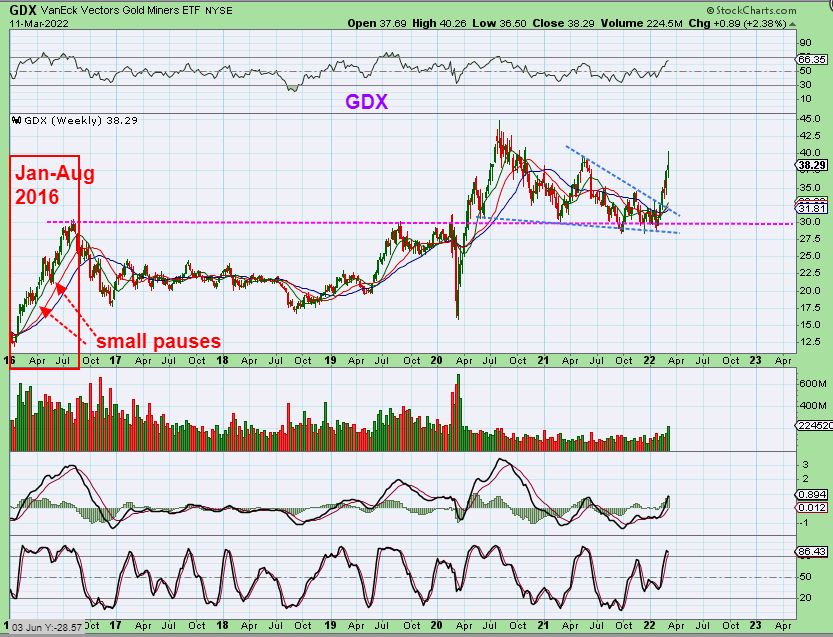
Here I am pointing out in 2016 that there were ‘Pauses’ at daily cycle lows along the way then too. I expect this current run to continue higher, but we may have ‘pauses’ along the way first. Next week is a Fed Week and we are within the ‘cycle timing’ for a DCL, so we must expect a pullback on this coming week.
.
SO THE GDX WEEKLY CHART has that ‘topping’ candle too. I am cautious when I see that, but I have also seen those before and price continued higher too (blue arrows). Here I am pointing out ( where I wrote ‘top?’) an example of that where we had one of those candles about 1/2 way up. It dropped for 1 week and then shot up higher. In the coming week a dcl (Daily Cycle Low) is due and the Fed meeting is scheduled. We have to at least expect a dip.
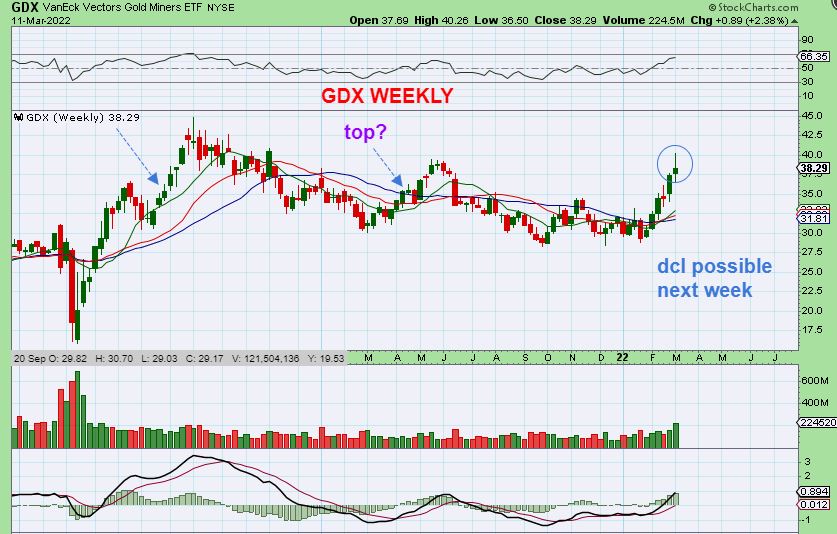
GDX WEEKLY – This is the same view, but I drew in a possible 1 week drop on Fed Week next week, and then that continuation higher. I would love to see this chart play out this way even though we have to endure a dip on Fed Week. Many miners are still giving us surprises to the upside, so a basket of miners might not pull back all that much.
.
If you get a chance, check out WEEKLY Charts of SSRM, NEM, GPL, VGZ, TRX, PVG, AUMN, and more. I think you’ll be surprised at how good these all look. It does look like the Juniors are starting to play catch up too.
.
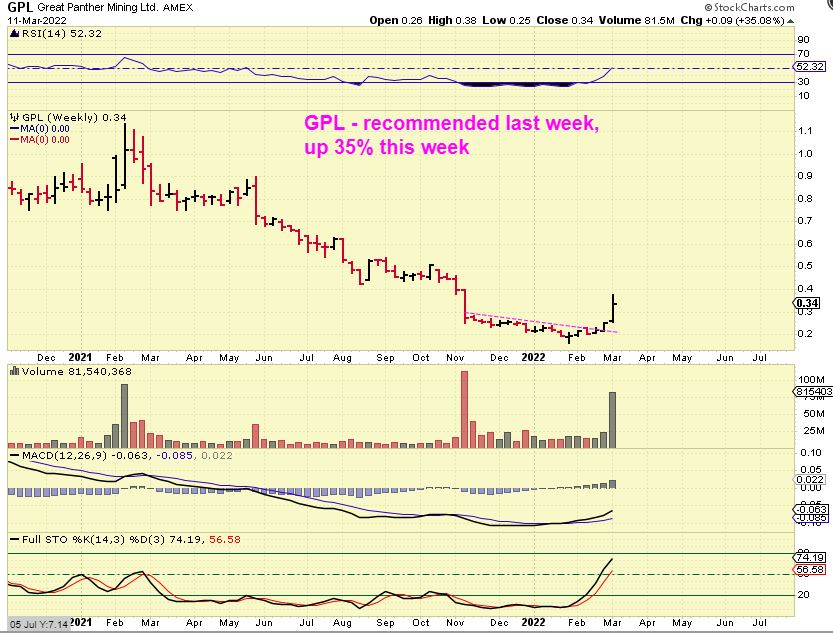
For example, GPL was recommended on March 4th with these 2 charts…
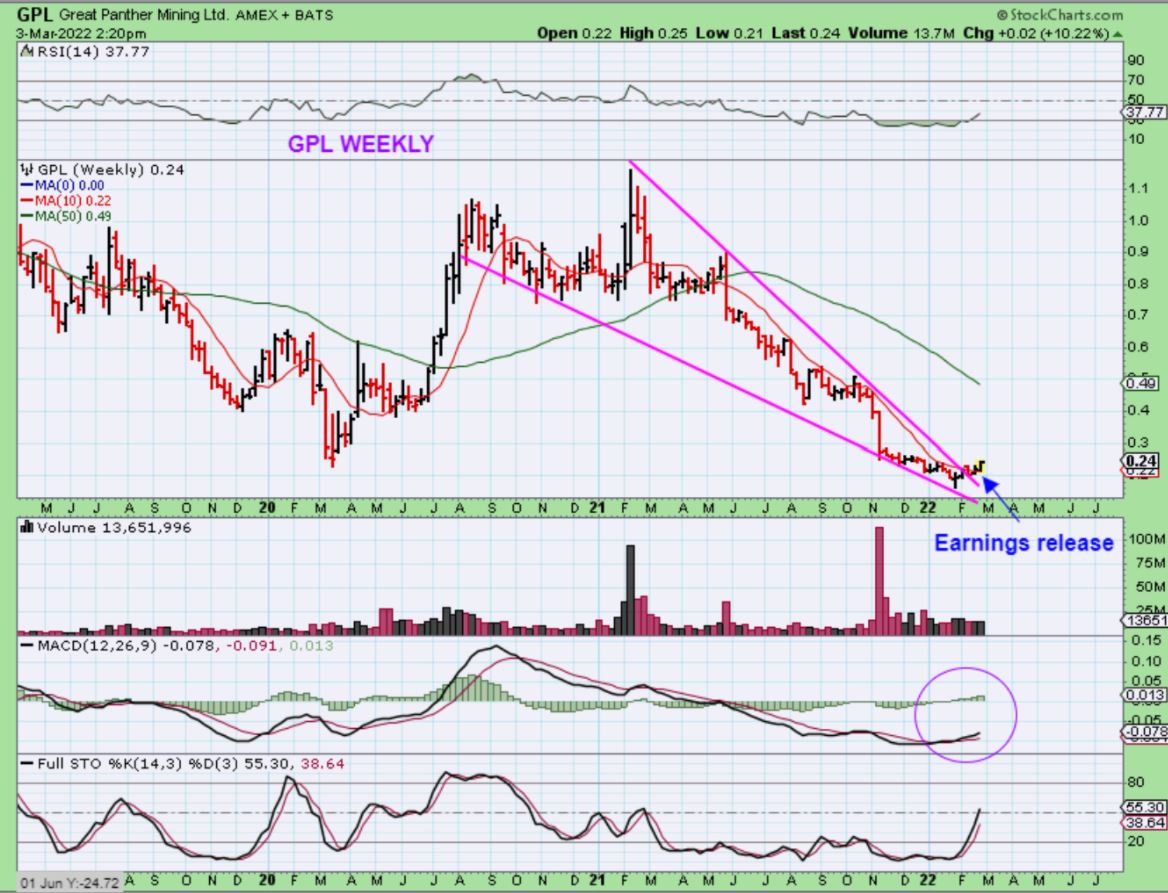
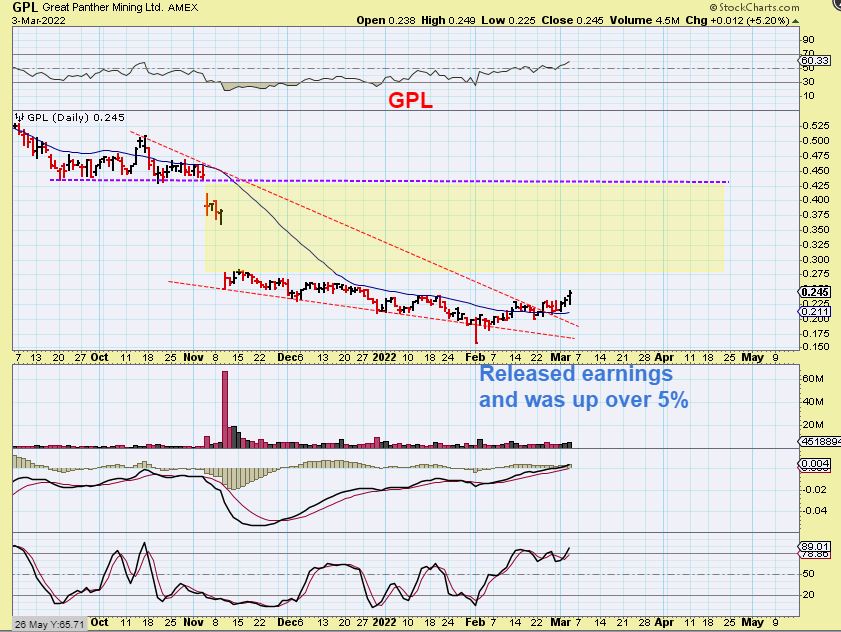
GPL was up 35% last week. Take a look at those others on a 2 yr weekly chart ( GSV, AUMN, PZG, etc). These may be set up to run next.
.
Things have actually been playing out very much as expected over the past few weeks, with the General Markets struggling and pushing lower (we have shorted the bounces) and the Precious Metals running higher. Now we are at that point where the Fed Meeting has arrived and both of those sectors are ready to dip into a dcl. Once we get through the F.O.M.C. Meeting and we get the anticipated dip into a dcl for the Precious Metals, that should be a buy signal for any that want to add. With the timing for Gold currently being day 31 Monday and day 33 Fed Wednesday, it is possible that the DCL COULD even come the day before Fed Wednesday, the day of Fed Wednesday, or the days after. We just have to watch how things play out, but things have really lined up well with our expectations!
.
I hope that you’ve enjoyed the Weekend Review, thanks for being here at Chartfreak with me!/
~ALEX
.
EDIT: These Weekend reports mainly cover the big picture and use weekly charts, but the day to day analysis can be found in the premium section Tuesday through Friday morning. I still cover the Markets as seen here, but when the set ups develop for trading or going long, I also include trade set ups in the daily weekday reports. If you think that this kind of analysis would compliment your trading, why not click on the ‘Sign up’ tab at the top of the page and try it out for a month. I have been expecting this pull back in the precious metals and we are looking forward to buying opportunities and bullish set ups that should present themselves when the dust settles, possibly right after the Fed meeting. Thanks for checking out the weekend report.
.
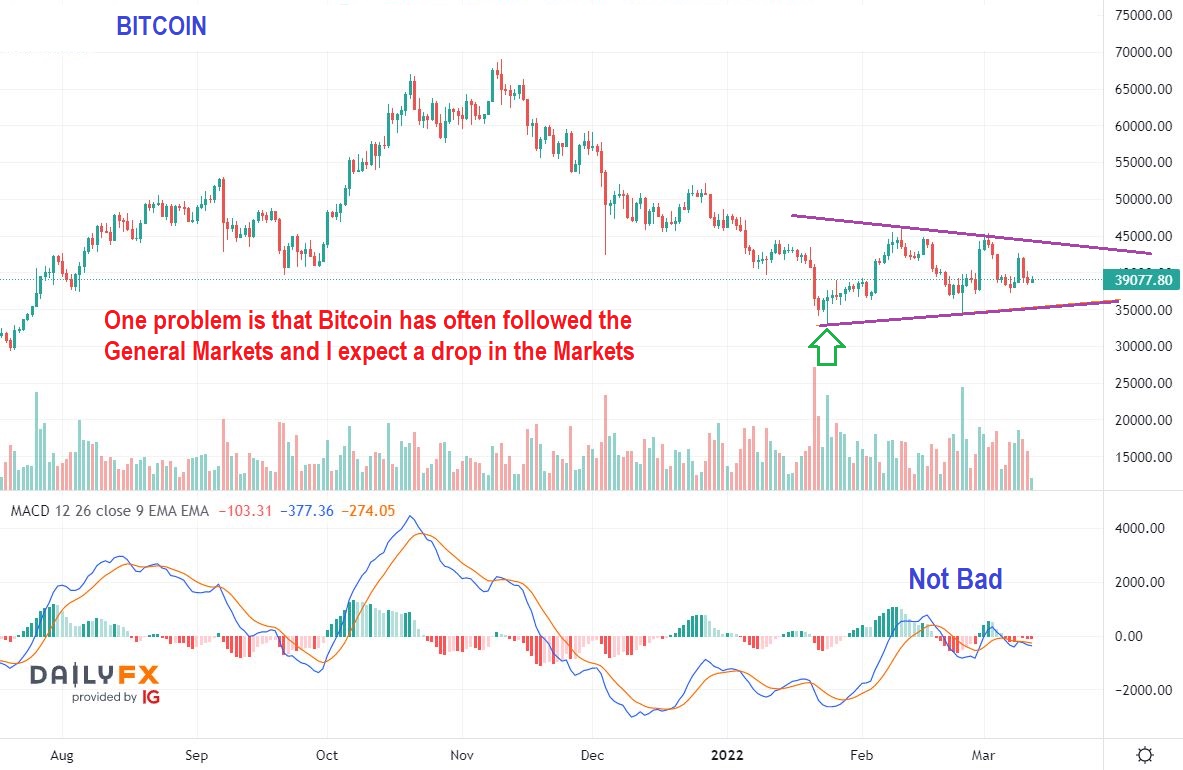
BITCOIN – This is not a bad set up ‘as is’, but the problem is that I expect lower price with the General Markets and Bitcoin often follows the General Markets . If it does NOT follow the General Markets lower and actually makes a higher low around day 60 in this triangle, this could be a bullish triangle for the next daily cycle to launch higher. The problem is that it hasn’t had follow through buying and we are on day 47.
1. We are running out of time for an upside rally to take place before a day 60 lows would be due.
2. Chopping sideways and putting in a higher low near day 60 is Bullish.
3. The problem is that Bitcoin also has too much time left if it breaks down with the markets or Fed Mtg. It could break below the lows and head for a deeper 60 day low.
4. Conclusion: Caution is recommended, and I am on the sidelines watching for a break out up or down. .
Welcome to the Weekend Report. This version of member premium report has been made public for you. Let’s do a quick review of 2020 in the trading world.
As 2020 draws to a close, the year that was terrible in many ways was nothing but absolutely excellent in Trading & Investing. After the March crash, we entered Miners and Biotech at the lows (Covid related Biotech trades) and made great gains into the Summer months from March into July & August. After a somewhat dull period of trading in August, things really ramped up with our Solar, EV, Clean Energy, Blockchain and Bitcoin related trades and eventually Oil stocks entered the race. What may be the next best trades? Miners again.
.
Well, after Selling Leverage and most of my Miners in August and finding other areas to trade in, we’ve been tracking and monitoring the Precious Metals sector for that consolidation phase to end and for the next leg up to take hold. The evidence shows that we are there, so with this kind of rotation, things still look really promising going forward too. Lets get into the report, discuss the big Picture Charts, and see why the Precious Metals Sector is looking promising to me. To the charts!…
.
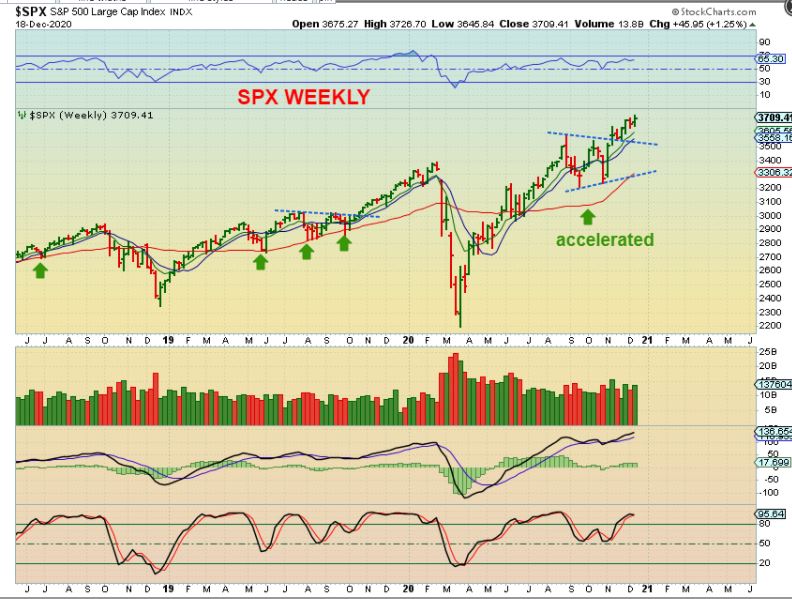
SPX WEEKLY – After a very strong rally out of the March crash, we experienced a consolidation (and an ICL) that has taken the shape of a triangle. Though I have discussed a blow off top possibility over time, this Triangle also may be a 1/2 way point in the rally higher. So far the markets remain Bullish.
.
So far the markets remain Bullish, but let me discuss briefly that ‘blow off top’ kind of rally again…
.
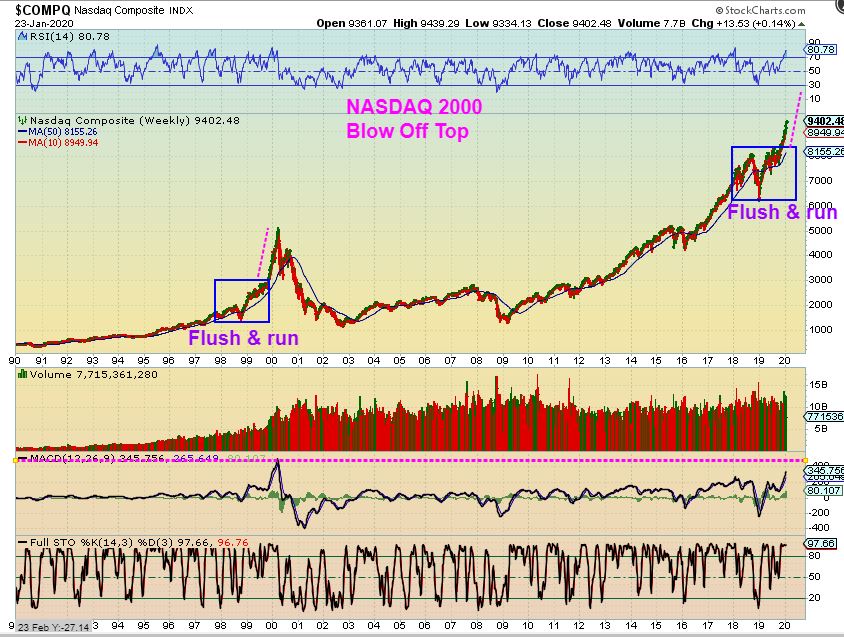
NASDAQ WEEKLY – The funny thing is that with this chart in Jan 2020, I warned of a ‘blow off top type of a run’ after that flush out crash in 2018. I said that the rally could continue into 2020, but then we could see a crash similar to the 2000 top. See the chart below. Well, we did get that crash in March 2020, but the blow off top wasn’t finished apparently, because…
.,
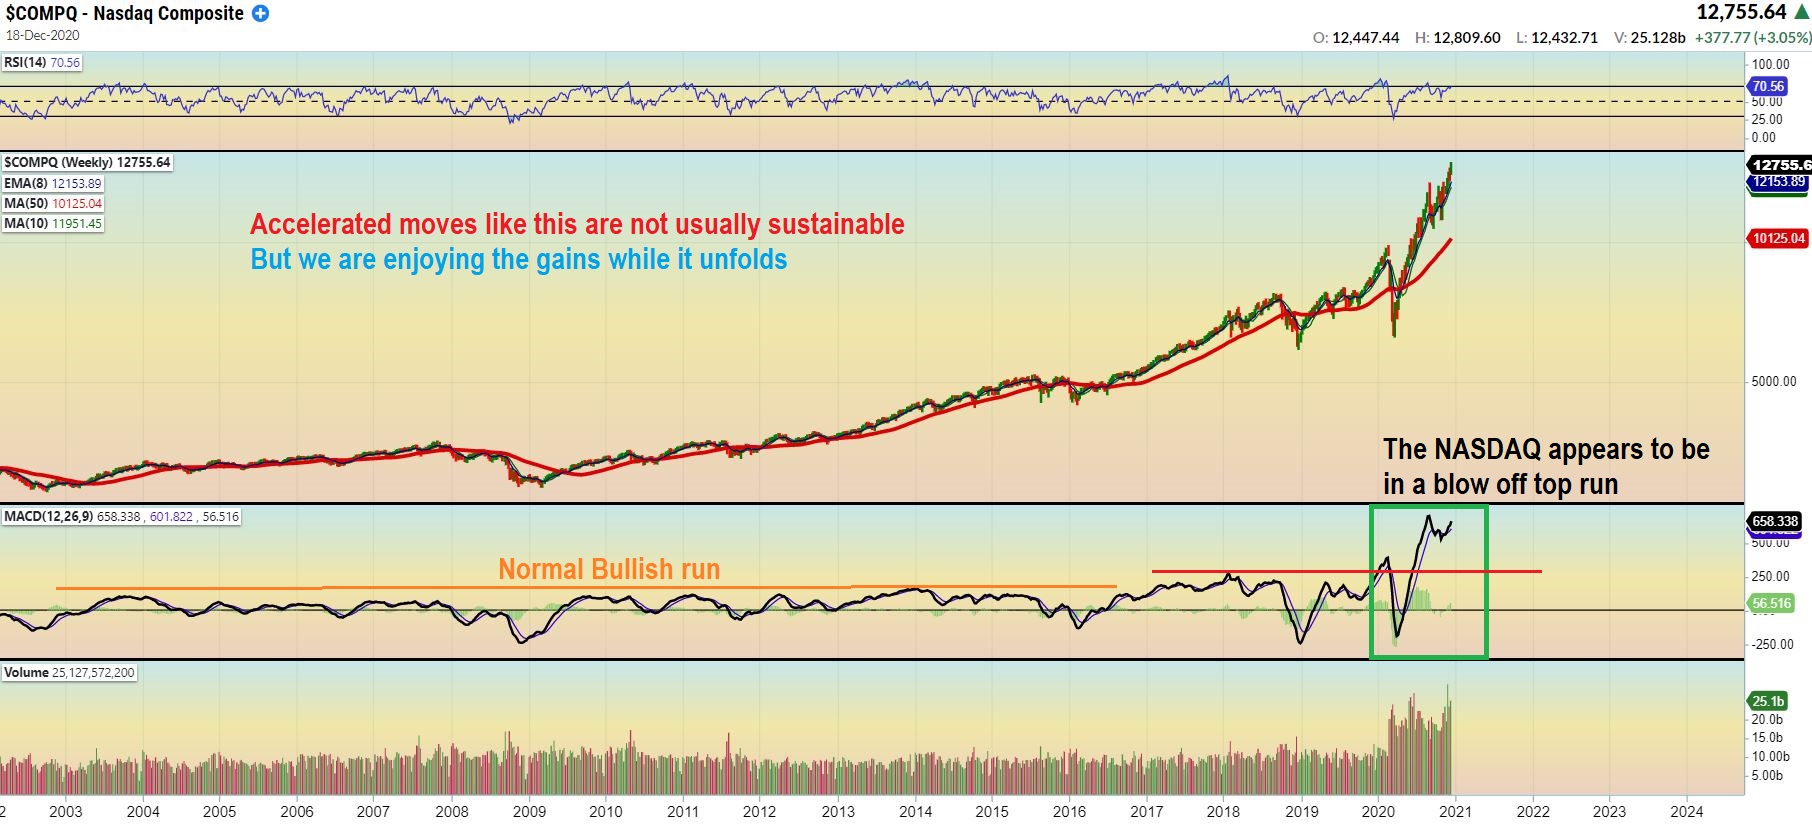
NASDAQ WEEKLY – You can see that we did get that crash in 2020 (March), but then another blow off rally seems to be taking place. This rally even appears to be steeper. We have enjoyed this rally through 2020 and the gains have been great, but I want to keep us aware that these kinds of straight up rallies just cannot be sustained forever. Stay Frosty my friends! I will continue to discuss these things in the weekday daily reports too.
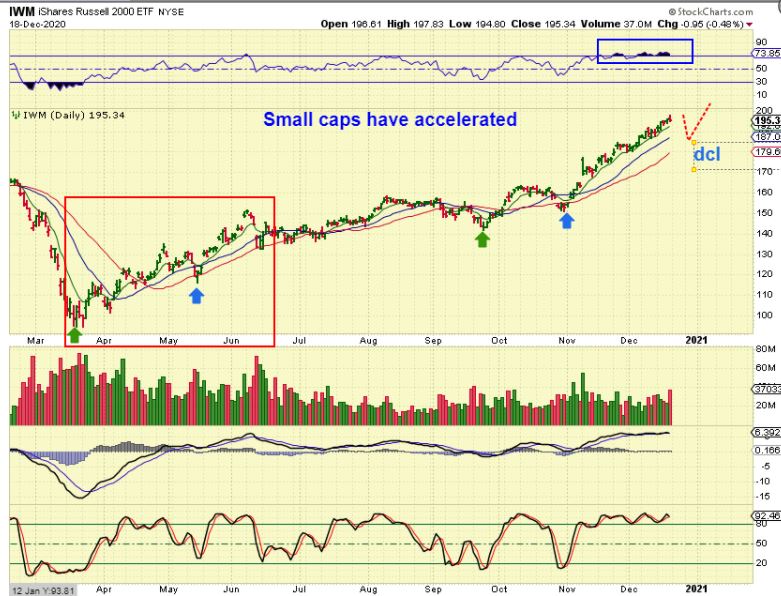
IWM DAILY – The Russell 2000 was lagging a bit, but it also started to ramp up in November. Let’s take a look at the Big Picture for the small caps too…
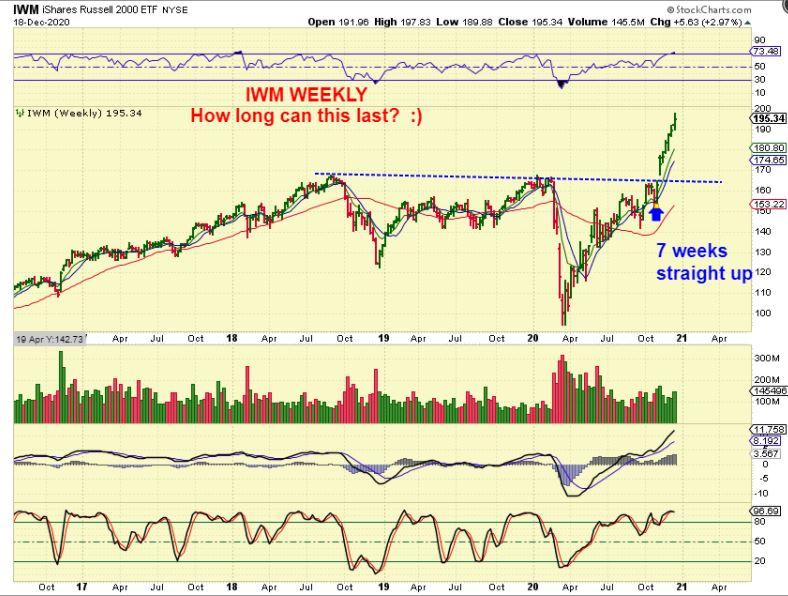
IWM WEEKLY – From this perspective we have had a straight up rally with 7 straight green weeks. This can continue into 2021, but can it last indefinitely? No. This 7 week ramp up only adds to the idea that these markets will eventually get too frothy and top out.
.
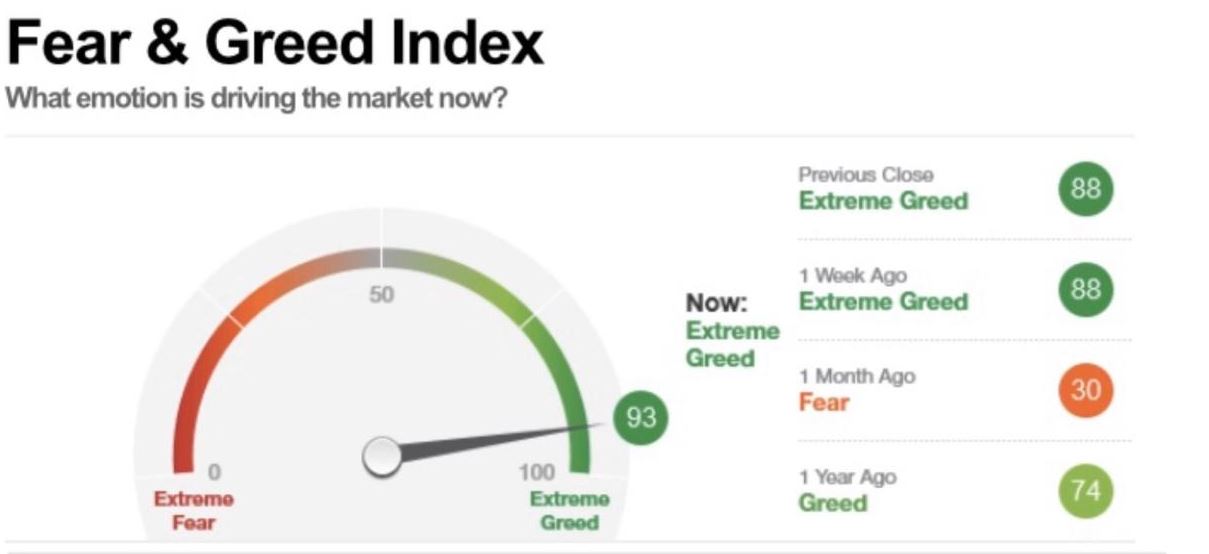
SIDENOTE: I posted this in early November to point out that we needed to be very cautious, since things that I monitor like the PUT/CALL Ratio and Fear % Greed indicators, and a few other extremes were calling for at least a short term top.
.
.
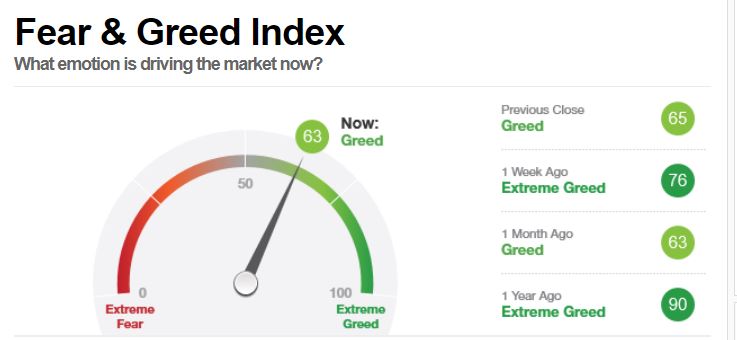
The GREED side of this indicator has calmed down closer to the midrange level of 63 with our recent chop & pull back into a mild DCL (Daily Cycle Low). The Put Call Ratio also improved quite a bit, so we should still see the rally continue for a while longer from here.
.
At the end of the report, I will review and discuss a summary of what I see in the big picture for the General Markets.
.
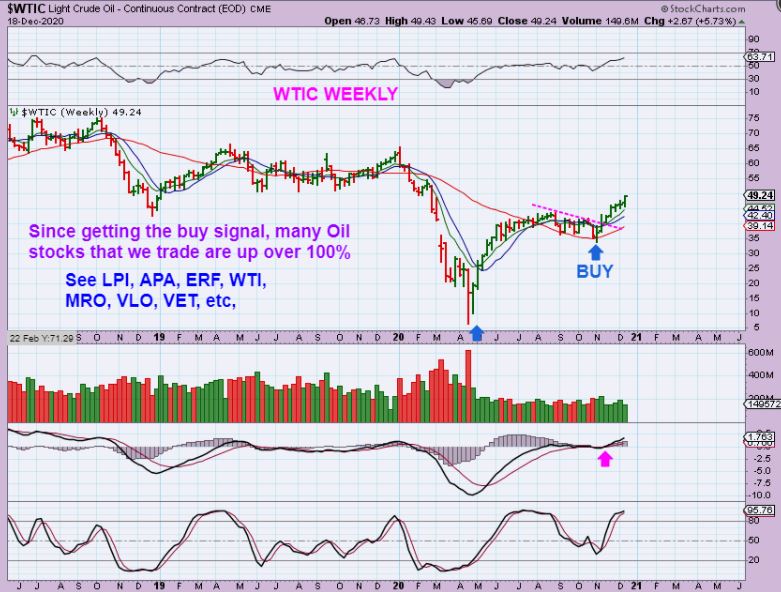
WTIC WEEKLY – After chopping sideways for weeks and months, we finally got The Buy. I was personally trading Solar Stocks, Clean Energy , and EV set ups so I only took a couple of these Oil Stock trades, and many of these more than doubled already! These should continue higher with normal dips along the way. I am mentioning this for a reason…
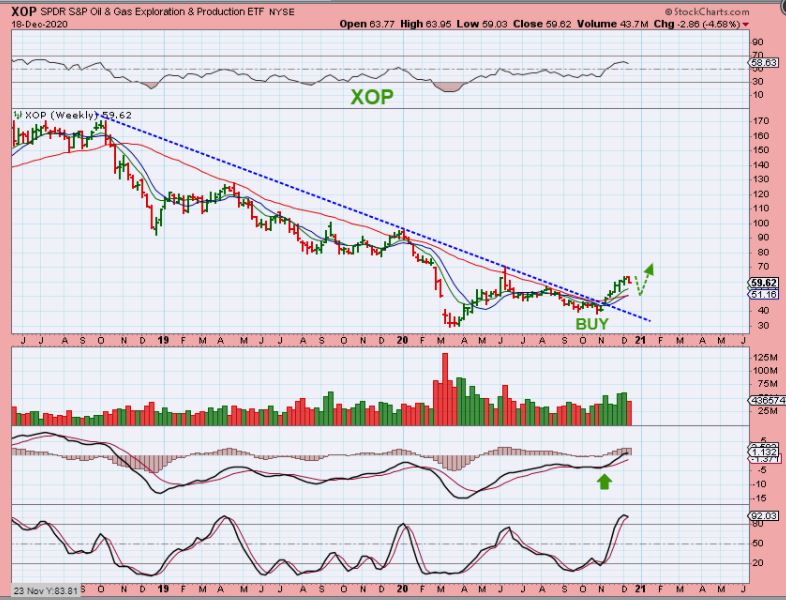
XOP WEEKLY – We got a higher low bottom buy here in the XOP as it broke a down trend line. I started to look at buying Oil Stock set ups like ERF, APA, WTI, AROC, CPE, MRO, VLO, COP, etc., so …
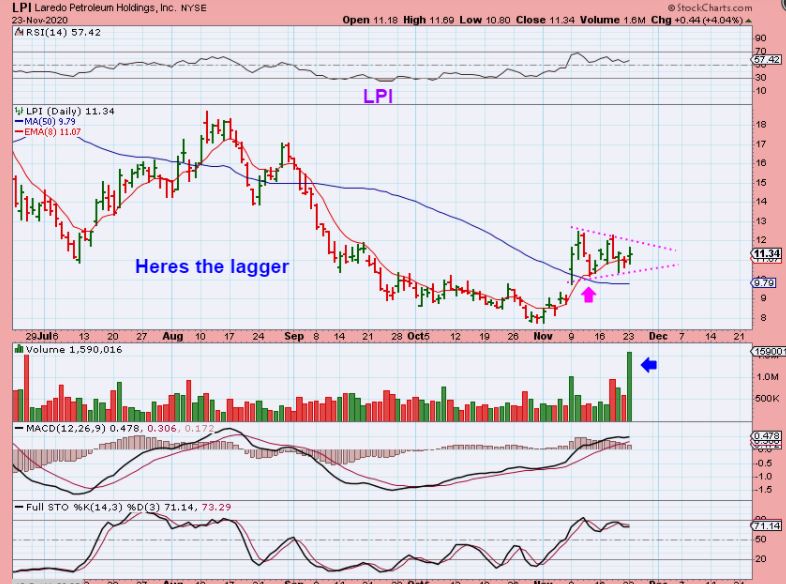
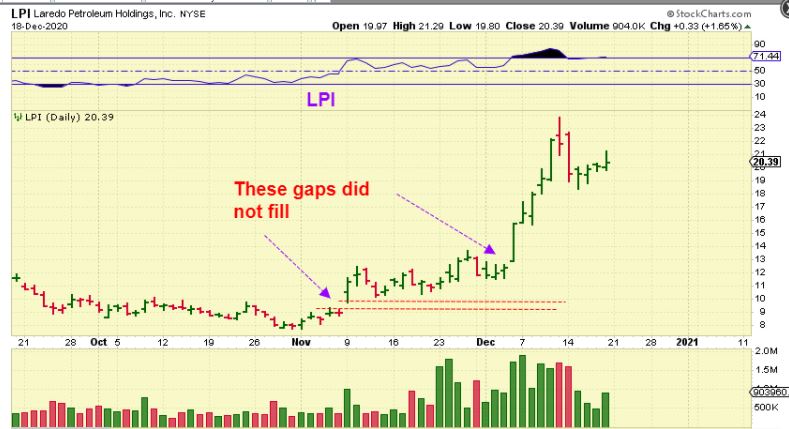
LPI DAILY – You may recall that even after LPI ran from $8 to $12, I called it a ‘lagger’ at the time and expected it to play catch up after this triagle forms. I said that I was in this trade with this Nov 23 chart near $11.oo. …
.
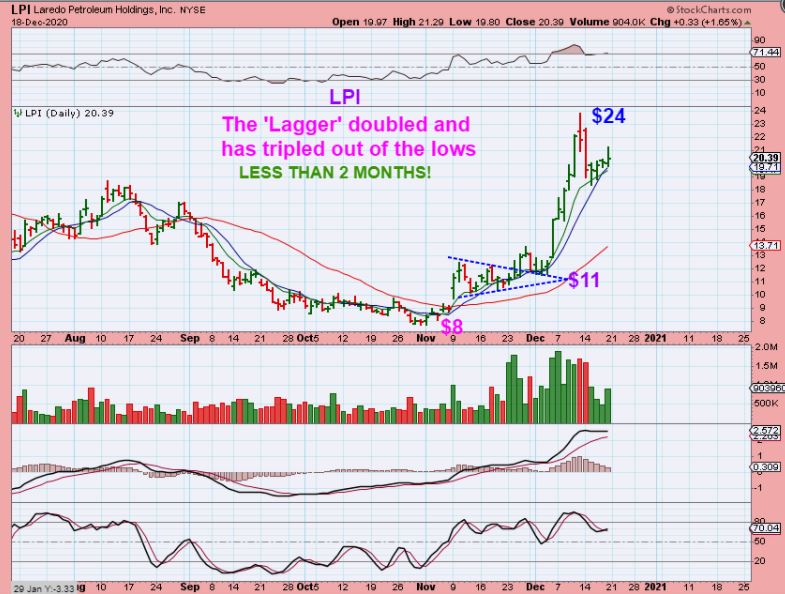
LPI DAILY – It has doubled from there in less than a month and tripled in less than 2 months. So why am I pointing this out?
.
MINERS COULD DO THAT TOO AND I FEEL THIS IS AN IMPORTANT LESSON FOR THOSE INTERESTED IN THE MINERS:
.
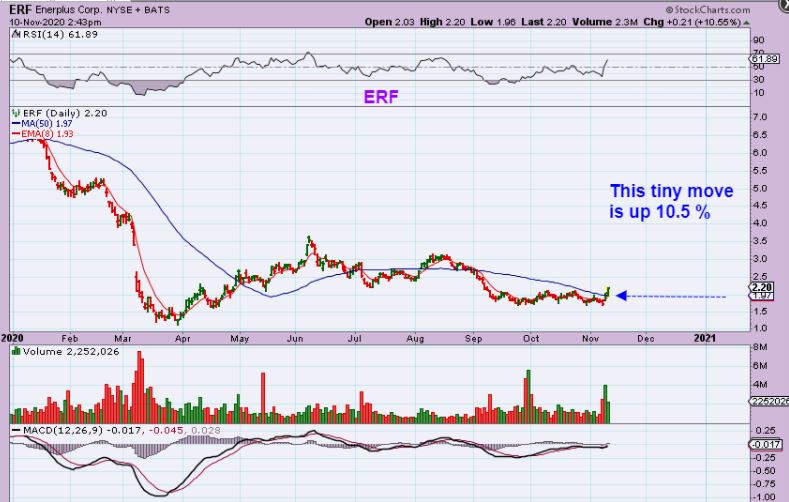
This is why am I pointing this out: When I first called these Oil stocks a buy, I said that they were a buy at the lows, like ERF here. I also bought this one, CPE, APA, etc…
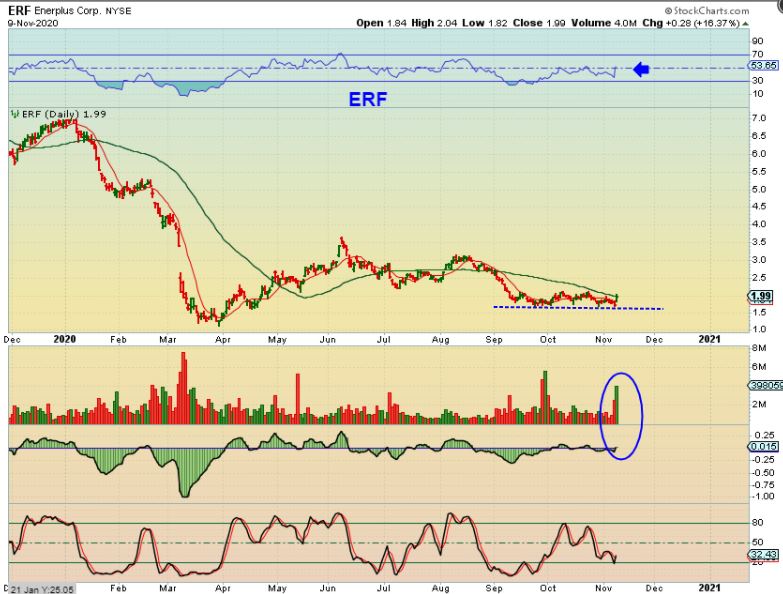
Most gapped open and closed up 10% or so the next day, and some that did not buy yet wrote to me and did not like the Gap up and wanted to wait to take position. You will recall that in my reports
1. I told them that break away gaps often do not fill, start a small starter &
2. Then add to it whether it dips to gap fill or if it rallies
.
As you can see with LPI: Many of those Oil stocks gapped open and never filled. I am pointing this out now because several Gold/Silver stocks started to gap open recently and I do have some readers that are saying they’ll wait for all of the gaps to fill. I recommended & started positions about a month ago with the GOLD ICL in November. If you don’t have any positions now, I would say that you need to at least have some starter positions. Most of the Oil stocks doubled within a month and so could some Miners, so if you start a position here on a dip, you then can…
1. Add to those positions if the gaps fill or
2. Ride them higher and add along the way too
3. I’ll discuss miners a bit more later in the report
.
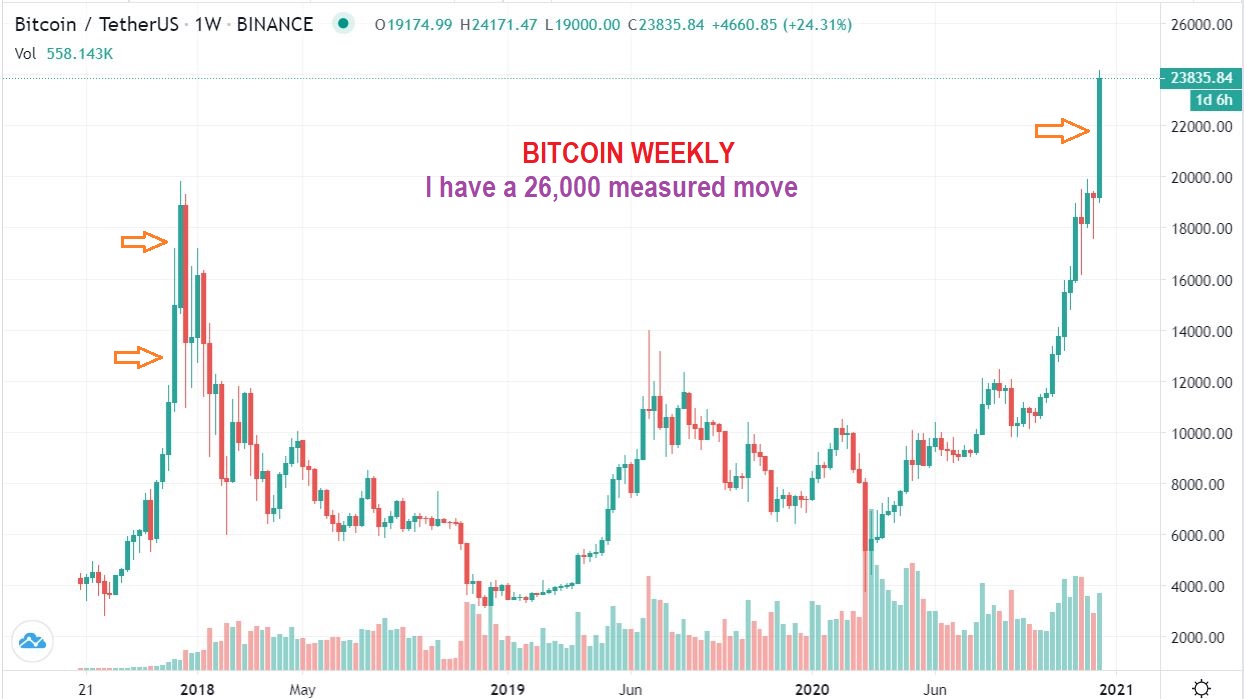
BITCOIN – We have traded mainly RIOT, MARA, and a few others like HVBTF , CAN, NXTD, XNET, FTFT, GBTC, etc .
.
From here I still have a measured move to $26,000, but with Bitcoin things trade a bit differently (for example it just ran from $3000 to $23,000!) . So I wouldn’t be surprised if it extends even further than that. Bitcoin & other crypto currencies tend to move in extreme measures.
.
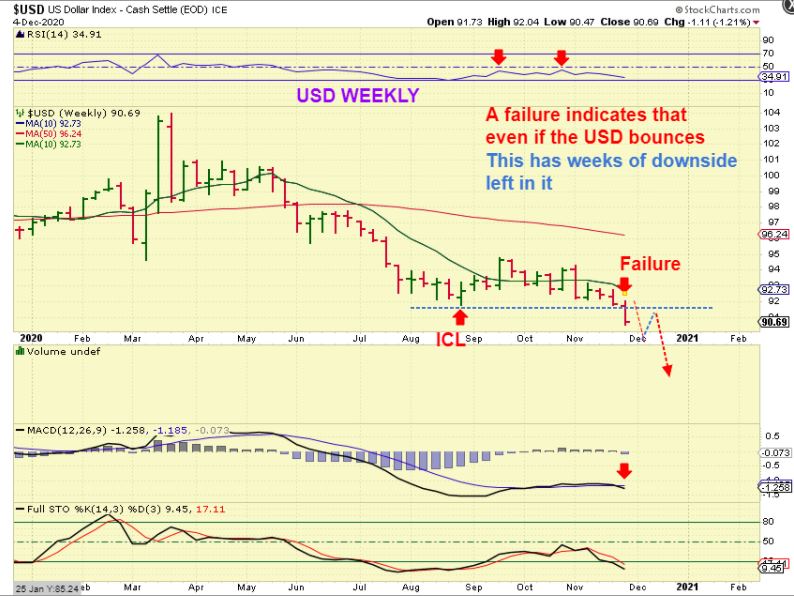
USD WEEKLY FROM DECEMBER 4th – I felt that we had an unconfirmed ICL in place with Gold in November, so here I discussed the implications of a failed Cycle in the USD (weeks of downside ahead). Please Read the chart. This should be helpful for Gold to rally out of that ICL.
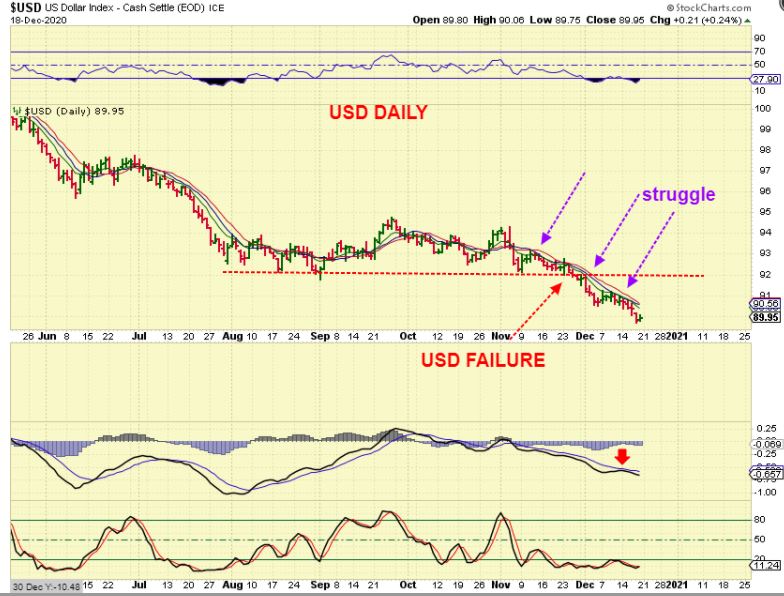
FAST FORWARD TO DEC 18th : The USD continues to sell off with the small bounces along the way unable to even get back above the 8 ema /10 sma. This will continue to Help the Precious Metals rally.
.
PRECIOUS METALS: BUY 🙂
.
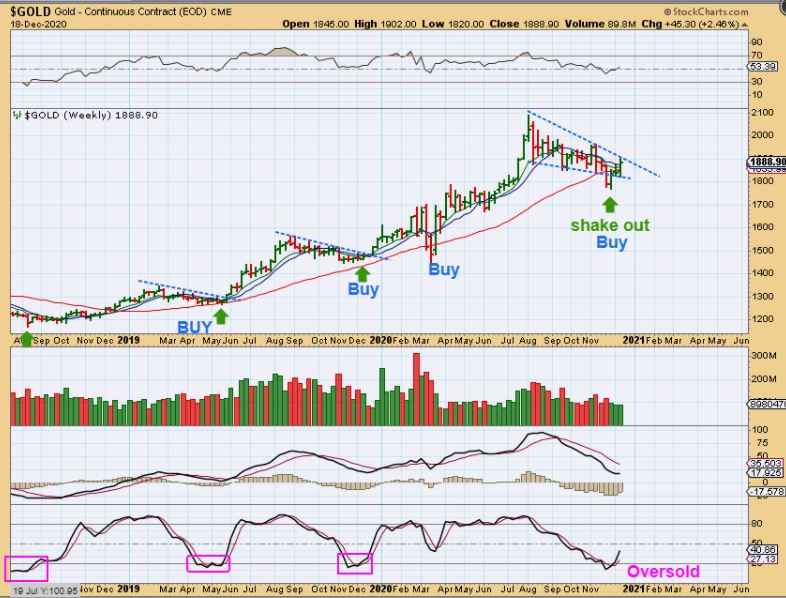
GOLD WEEKLY #1 : As mentioned Gold put in an ICL ( an Intermediate Cycle Low) in November and we began to go long or buy Miners at that time. Golds last ICL was in March, so the time was running late for this one to develop. Gold finally reached the oversold level of prior ICLs and reversed after a shake out of support.
.
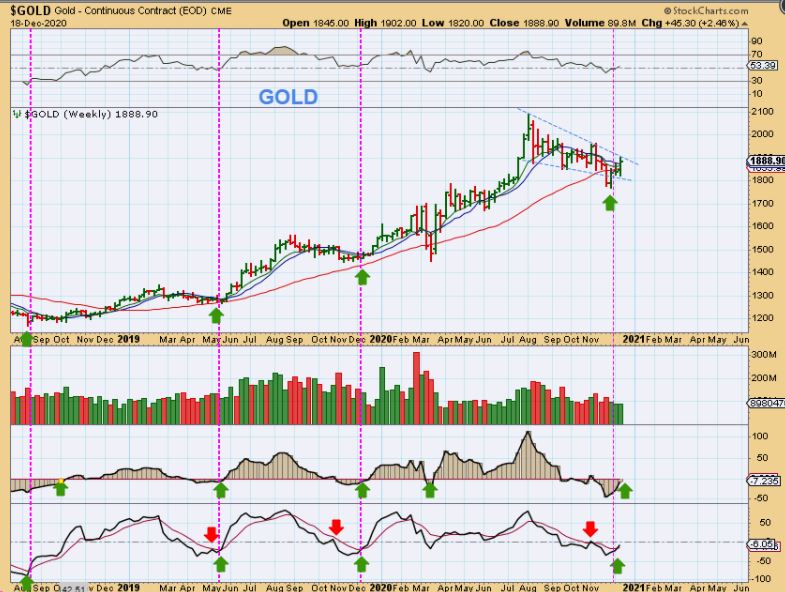
GOLD WEEKLY #2 – I developed the 2 lower indicators years ago and back tested them during the 2000-2011 Gold Run. They often ONLY cross higher when an ICL is in place. A push above the blue trend line on the Gold price would also confirm that the ICL is behind us.
.
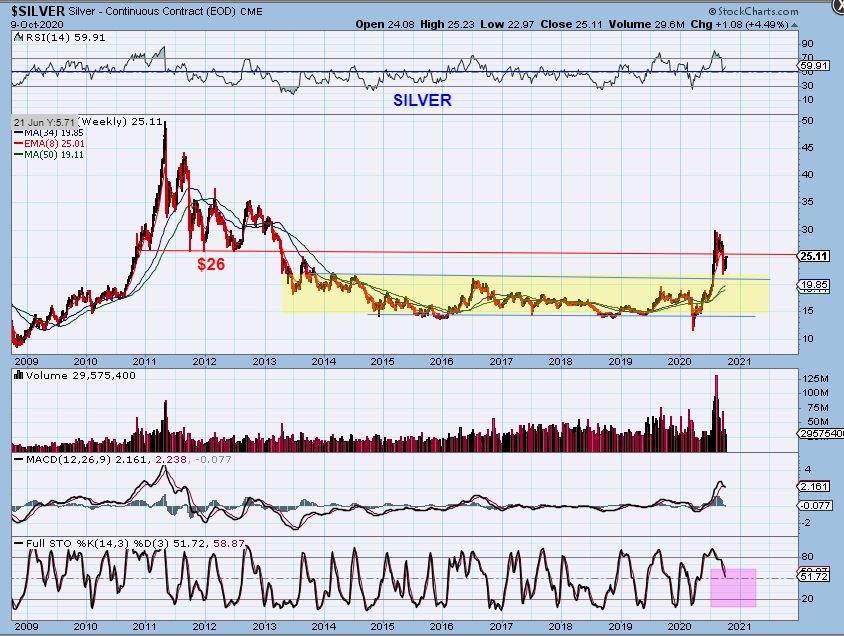
SILVER WEEKLY OCTOBER: To be honest, I was thinking that Silver would drop to $20 for the next ICL as a back test of this break out. At this point Silver has dropped to $21.66 and now I am comfortable with the idea that that is all we will get…
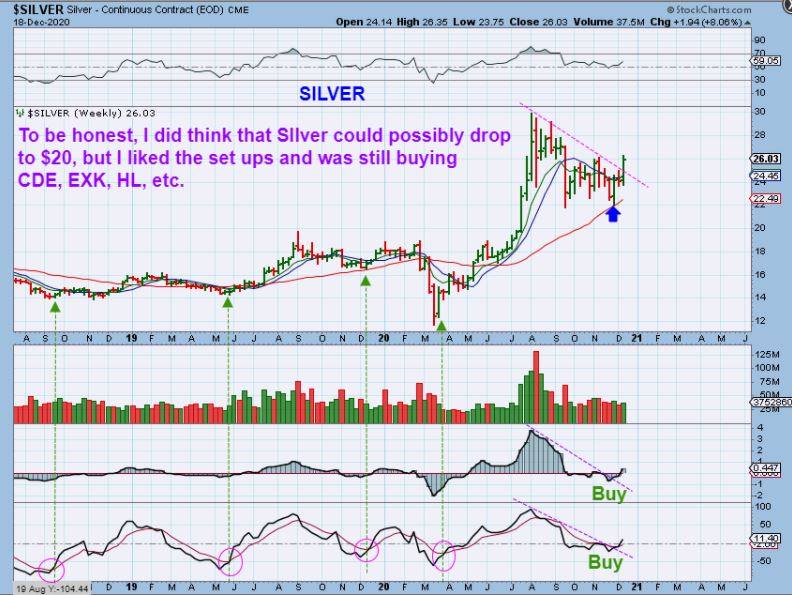
SILVER WEEKLY DEC 18 – Silver is breaking out from a downtrend now, but thankfully we were buying Silver stocks a while ago. The Buy Signal in Silver triggered at the end of November too.
.
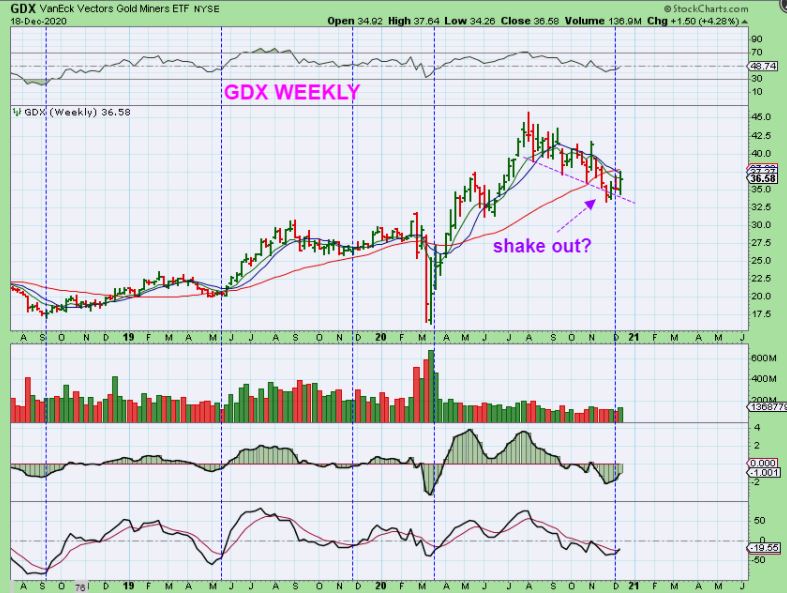
GDX WEEKLY – After calling the low and buying Miners, the move out of the lows was delayed with sideways chop for 2 weeks. Day after Day the slow chop made it a bit difficult times, wondering if the lows would be taken out, but they held up and never broke down. This week we especially saw Solid Upside in many individual Miners . I think we are seeing a shake out in the GDX ETF.
..
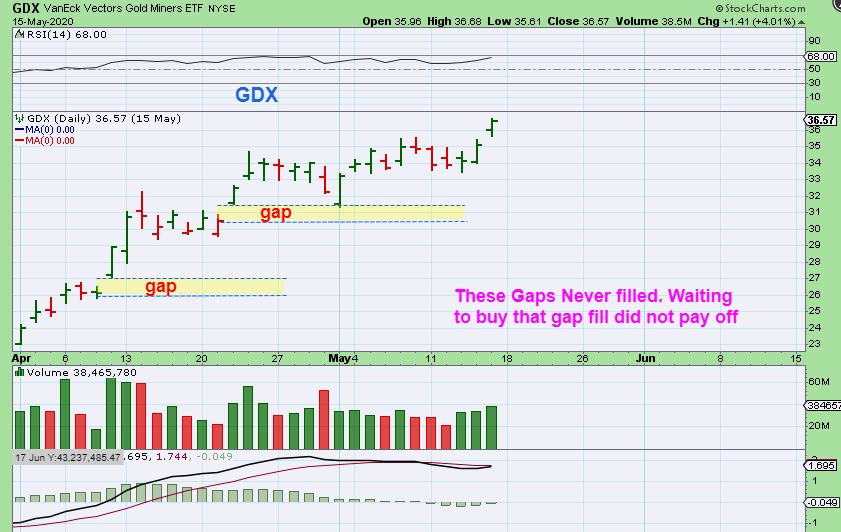
FOR THOSE THAT WERE WAITING FOR ALL GAPS TO FILL: FROM FRIDAYS REPORT: If you waited for these gaps to fill to buy back in April 2020, when would you have had a chance to buy? You would have actually missed the run. When an ICL is in place I always say that you should just Buy ‘something’ and adding if it dips. If a gap does not fill, at least you are in.
So we all should at least have a core position from weeks ago and I have had many charts of Miners in the past 2 weeks of reports too. This week has been very rewarding, since many stocks like CDE, EXK, etc are up 30% alone just this week. This chart was as of Thursday and placed into Fridays report.
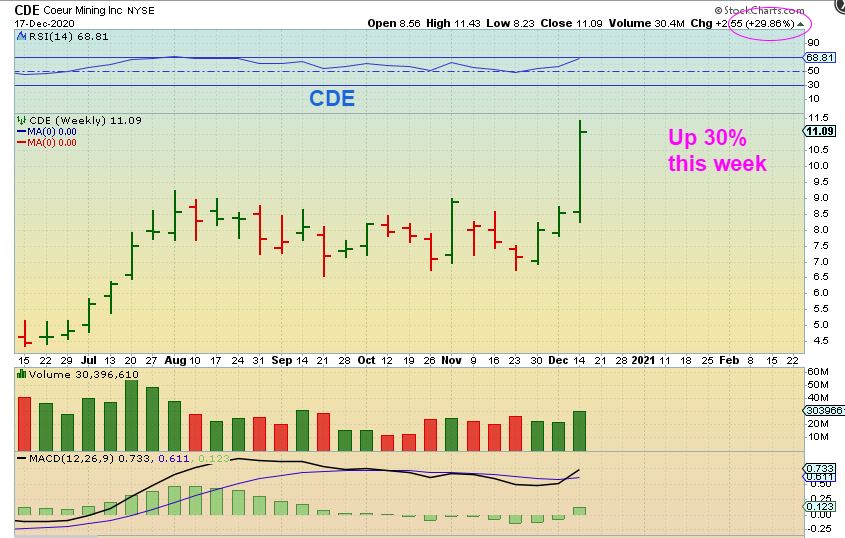
At the end of the report I will use CDE & EXK as an example of some of the coverage that was found during the weekday reports.
.
.
– The General Markets: A while ago I mentioned in a past report that it is possible that we get that so called year end ‘Christmas Rally’ because (at least in the U.S. ) people have such strong gains that they may not want to sell in 2020 and have to pay taxes on their gains in early 2021. If that is the case, we should continue higher into 2021, but as mentioned, a blow off top could form sooner or later. So while it is possible that the rally continues for a while longer, it is also good to have this ‘topping’ thought in the back of our minds so we wont be caught off guard if we top out.
.
– Oil & Oil Stocks: After the recent lows, the gains have come very quickly in this sector. many Oil Stocks are already up 100% , but they look set up to run even higher. The next dip down into a dcl should provide another low risk entry in this sector too.
.
– The USD broke down and is a failed intermediate Cycle now. Even if it bounces from time to time, I expect lower prices over time for the coming weeks and even months. This should help the Precious Metals.
.
– The Precious Metals : An ICL in Gold for the month of November should be confirmed with a push above this blue upper trend line in Gold. Silver has already broke above its downtrend line.
We started buying Miners in November and have also increased positions recently. I’ve also posted charts of many Miners in the past couple of weeks with low risk set ups and they are already performing very well! If they perform as well as the Oil Stocks have, many could double rather quickly. Since there are also some Miners that are still close to their lows, this may be the next best sector to make nice steady gains in.
.
We’ve had some exciting trading over the past several weeks and it looks like we may have some more great opportunities ahead. Many sectors remain very bullish and it looks as though we will have many more opportunities and trades ahead. Rest up, Enjoy your weekend, and as always thanks for being a Chart freak with me!
.
~ALEX
.
. .
Below is just a small example of some of the charts and information provided during the weekday reports when looking for entries in some of these Miners.
..
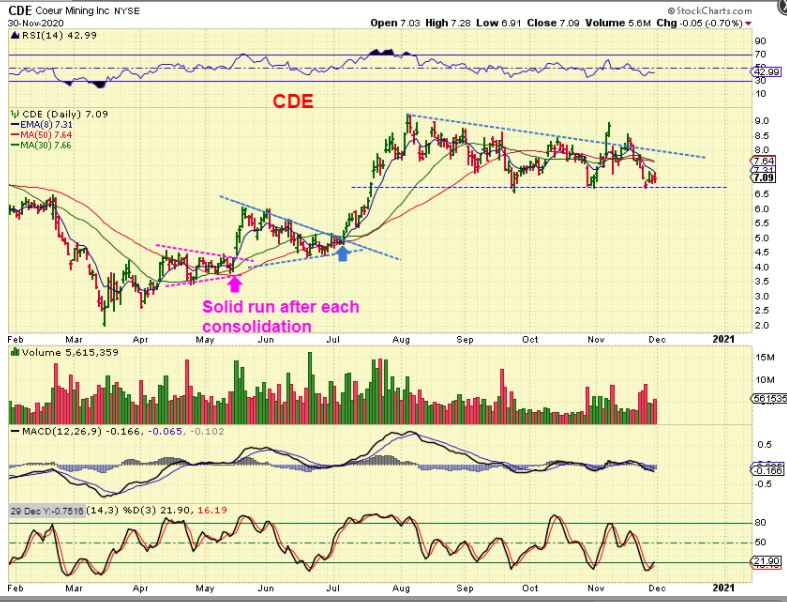
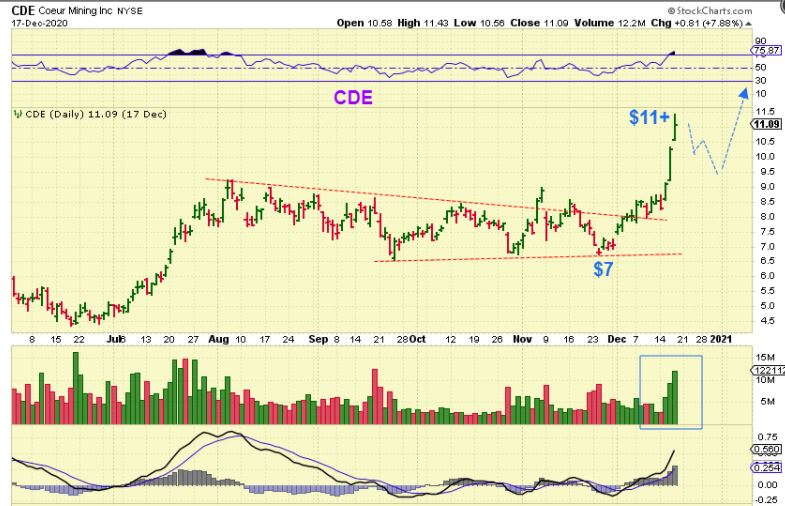
CDE NOV 30 -With a dcl (Daily Cycle low) and most likely an ICL in place in November, we could buy CDE with a low risk/ high reward entry, using a stop under price. I bought near $7.
.
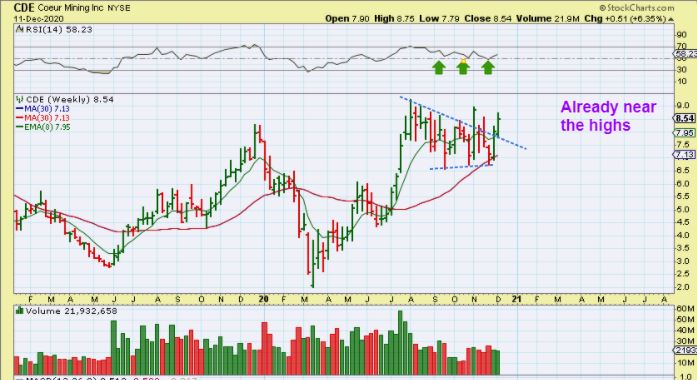
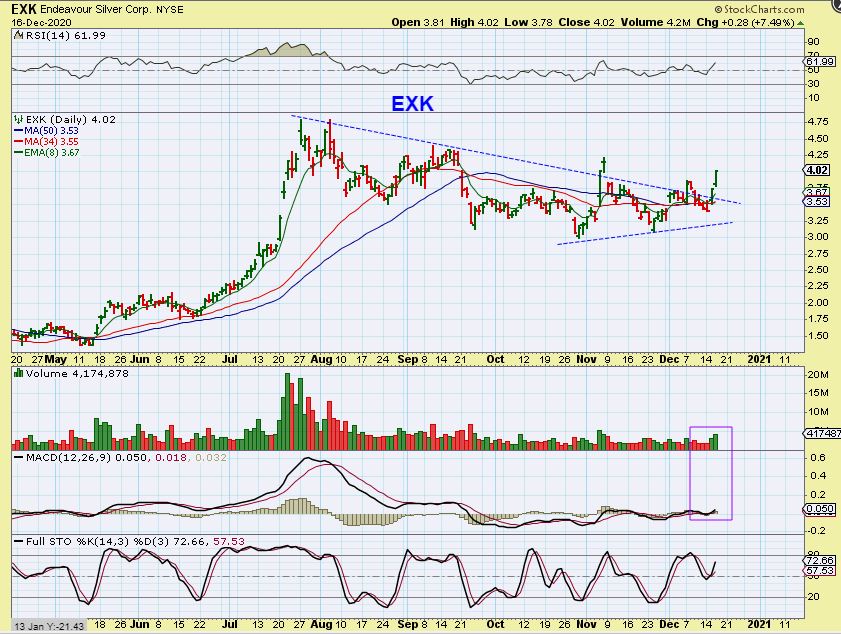
CDE & EXK WEEKLY – Now by Dec 11 Price started to run higher, so I used weekly 2 charts to show the weekly set up for CDE & EXK. They were also quite bullish and had lots of upside potential.
.
EXK WEEKLY was pointed out as a buy at support too, near the $3 to $3.25 area . This weekly chart was in a report to help to show the bullish set up & potential was playing out and it was still a low risk type of entry.
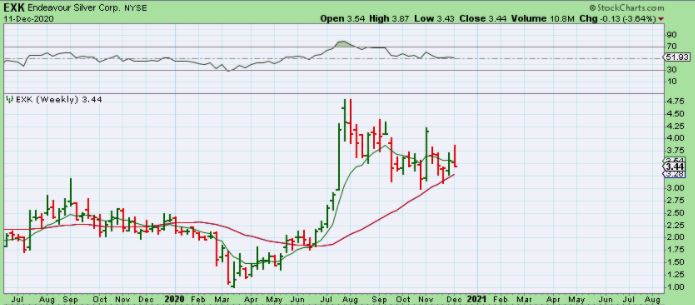
When EXK popped over the 34sma this week at $3.50, it was an immediate buy (or place to add to your position), so I mentioned that I added.
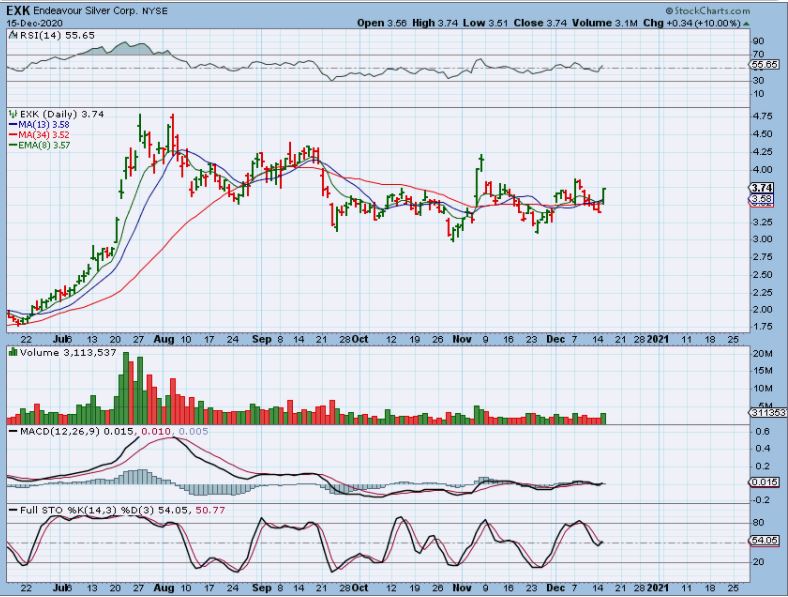
,
EXK saw immediate follow through too, now over $4.00.
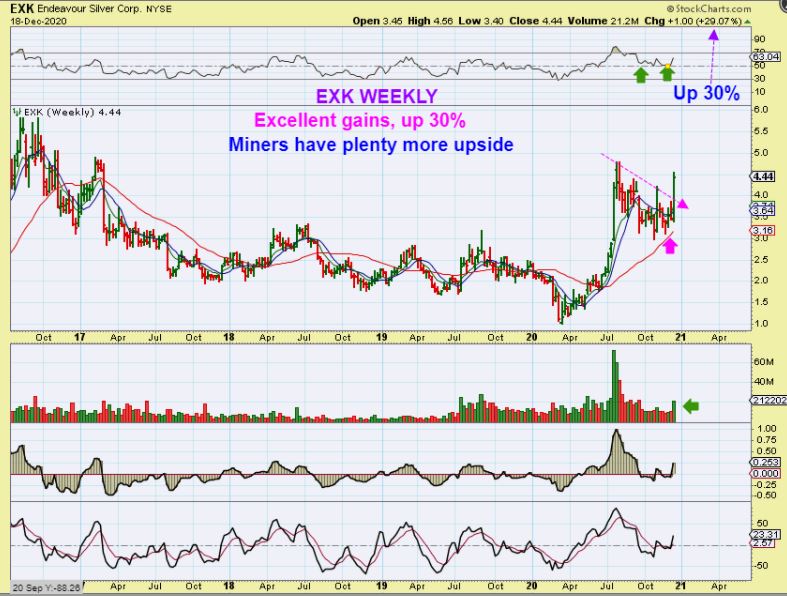
Now look at the Big Picture. EXK is already at $4.44 and was up 30% this week alone. The buy was anywhere from $3 to $3.50. These move quickly!
BACK TO CDE:– Now from our $7 buy CDE was quickly up over $11 as of Thursday. It may pull back as shown, since it did start to dip on Friday, but from here it would be considered a buy the dip opportunity. Why? Well…
.
I used this chart in my report on Dec 16 to show the kind of upside potential that some of these Miners have. A quick run from that $7 entry to $15 is very possible, but since I expect weeks and months of upside out of an ICL, this can even go a lot higher than that. 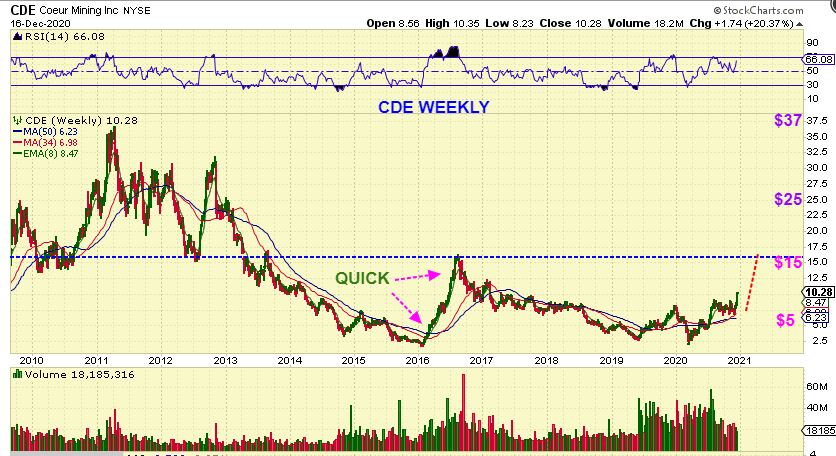
.
I also made a few more purchases this week of some laggards that I pointed out in the daily reports. They have already started to make gains since we bought them too. I will continue to cover the Buy Set Ups in various Miners in my daily reports.
I wanted to open up my weekend report to the public. Enjoy!
Read More I have been asked what my Long Term Outlook is and has it changed after The Fed discussed their plans going forward. I usually discuss the Big Picture in my weekend reports, and I cover short & medium term trades and 'stock picks & set ups' in the daily reports, so I have decided to release last weekends Big Picture Weekend report to the public.
Enjoy!
Read MoreThe Markets were ripping higher, and we enjoyed that ride for months too, along with the Bull Run in precious metals, but the question is, “Were Chartfreak readers warned or even prepared in any way for the large drop that we got as this week started?” The answer is Yes, we got a sell signal on Friday, one that I had been telling my readers to watch for . Let me show you how we were looking at the markets.
.
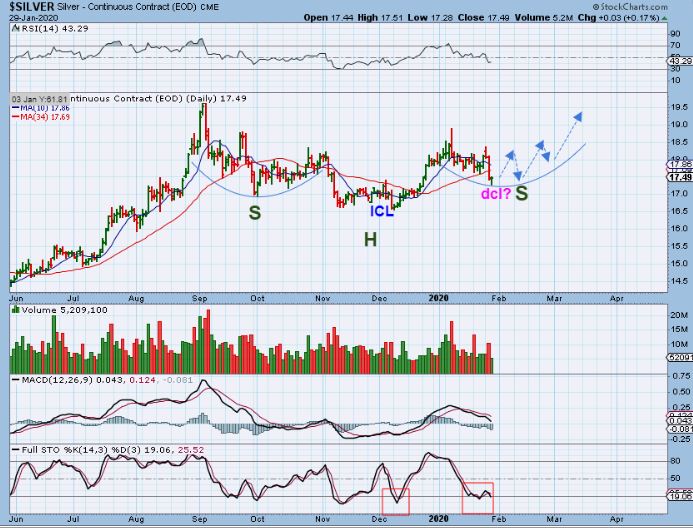
In late January, we were due to form a dcl ( a dip daily cycle low). The last one formed at the 34 sma, so I mentioned that this may be the next buy point, but I did warn that this one is arriving late in the entire ‘intermediate cycle’. With that in mind, I told my readers that we could buy it, but I also said that I would expect a break to new highs that could roll over quickly. We are due for a deeper drop into an ICL over time, so I told them exactly what to look for day after day.
.
.
SPX WEEKLY – On Friday, a sell signal that I had been giving my readers actually triggered, so we should sell & be out. In the weekend report I pointed out other reasons why now we need to be very cautious about being long or jumping back in. I had been showing strong divergence in my indicators. This looked toppy…
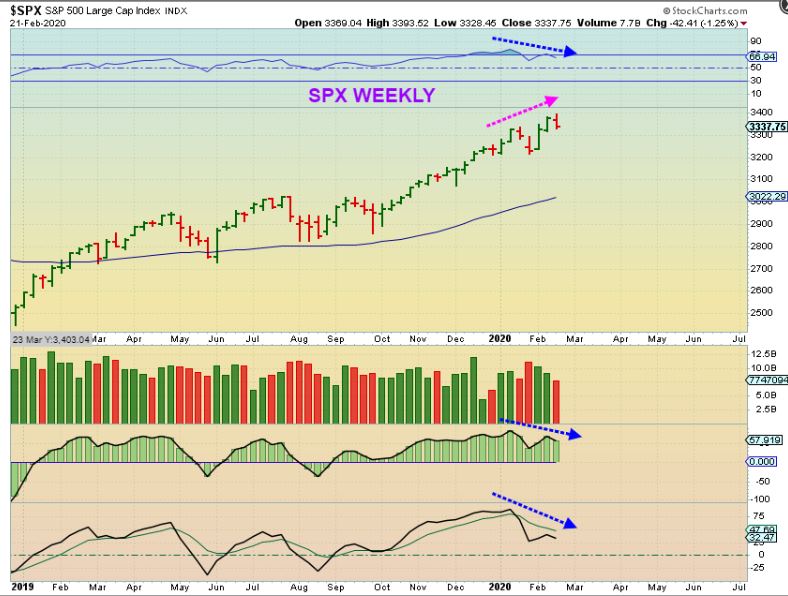
.
I posted this. Notice the blue arrows. After a long run, a break of the 13 sma led to a drop into a dcl. Thursday broke that 13 sma, and Friday was only day 14. A close lower was a sell. A BIG drop could follow over time, even chopping lower for weeks.
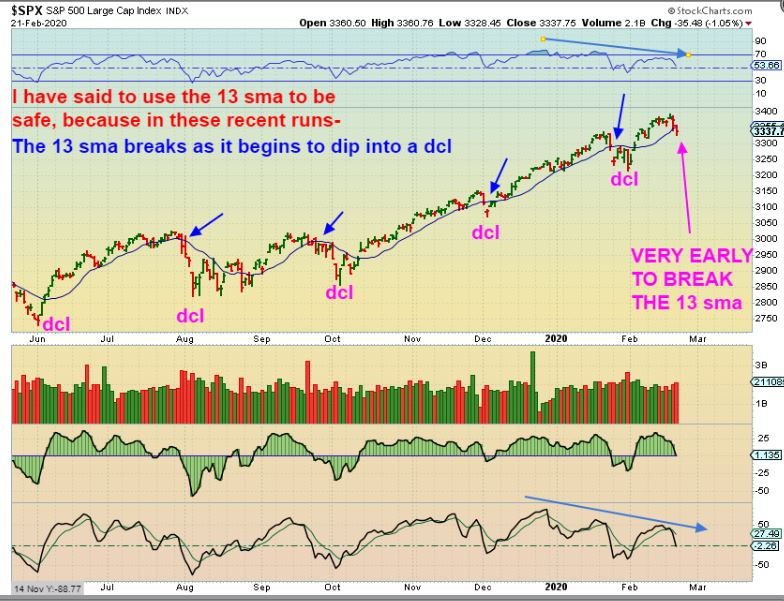
.
Here I tried to show that even when markets get stretched, every 6-8 months we should get a deeper dip (ICL) and we have yet to see that. An ICL ( Deeper dip) is overdue. We were expecting a drop, unless this market was just going to do a blow off parabolic drop. The sharp drop would then come later.
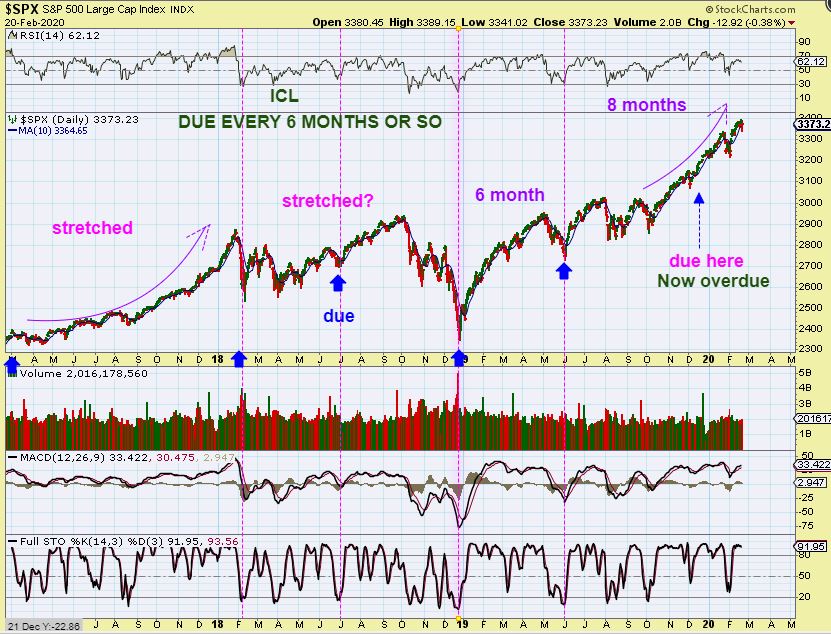
.
FINALLY THE SPX WEEKLY FEB 21. The Big Picture still looks as though markets could go parabolic if we only get a back test. The bull may remain healthy after a deeper ICL correction, while the shorter term daily charts above are calling a top here. This is ONE thing that I will be watching going forward. Will support hold or fail?
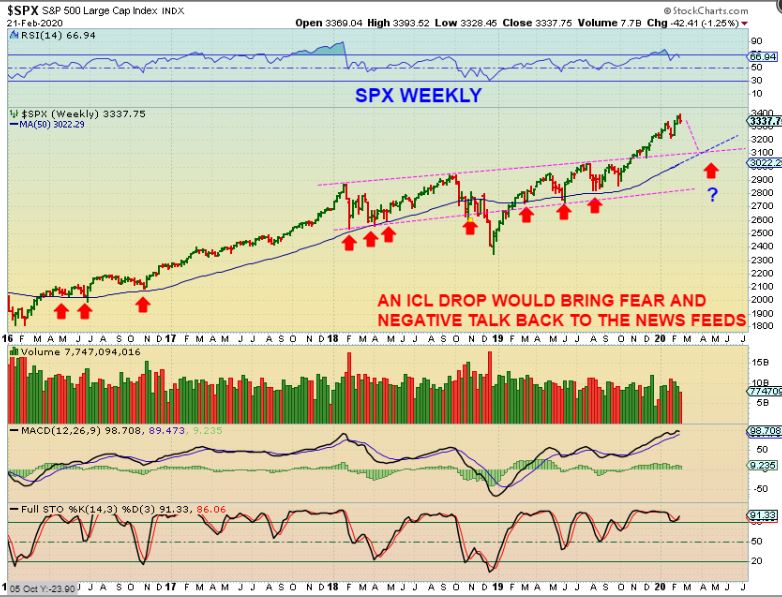
.
What about GOLD, SILVER, and MINERS? I had been tweeting out several charts showing that we were trading Miners successfully, but what was I putting in my day to day reports? Here is a very brief review of how we played that sector too.
.
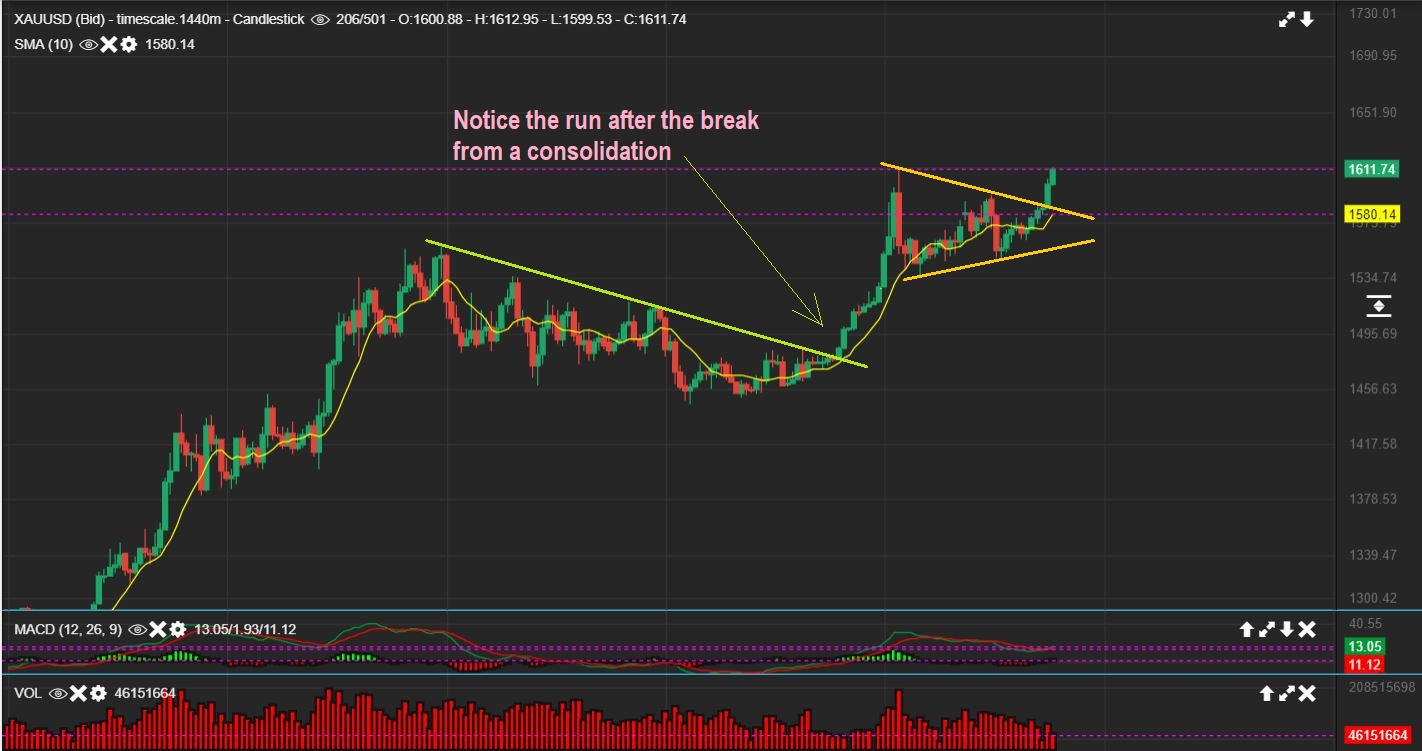
GOLD – We actually caught the ICL in November and this break out of the wedge / triangle was confirmation of the bull run continuing. NOTICE THAT I DREW IT AS LIKELY BECOMING CHOPPY AS IT HITS NEW HIGHS. Like a cup & handle. That was just to prepare us for the possible future chop.
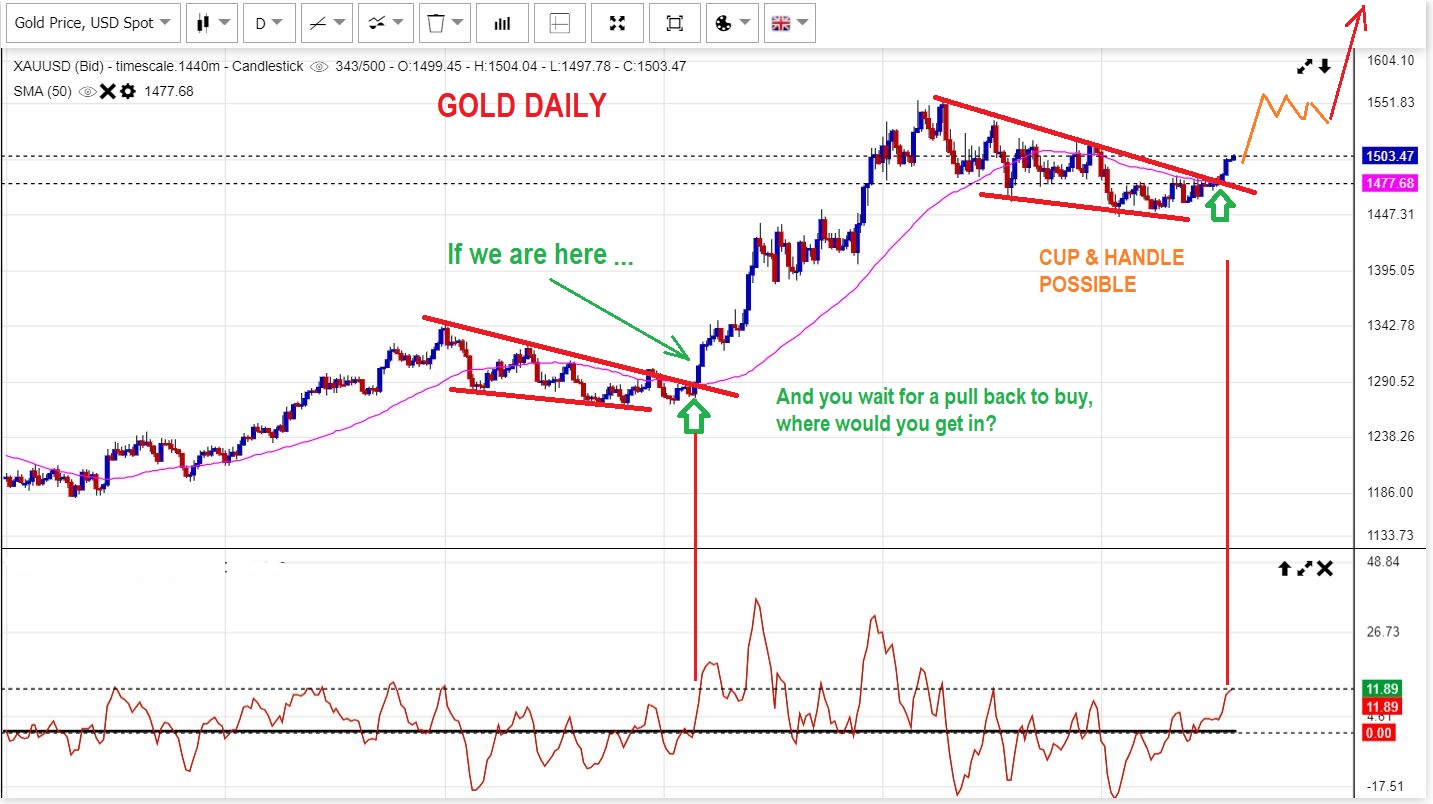
.
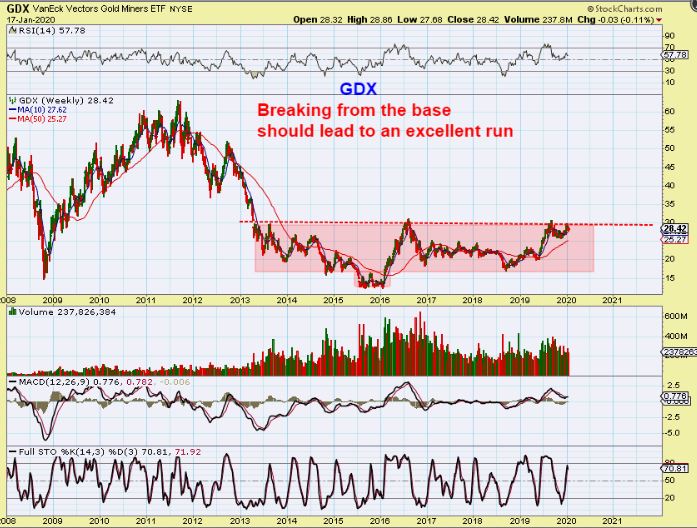
THIS WAS ONE OF MANY GOLD BIG PICTURE CHARTS THAT I POSTED WEEKLY. It shows us the Bull marching out of a base and back testing that break out. I said that Gold should continue higher.
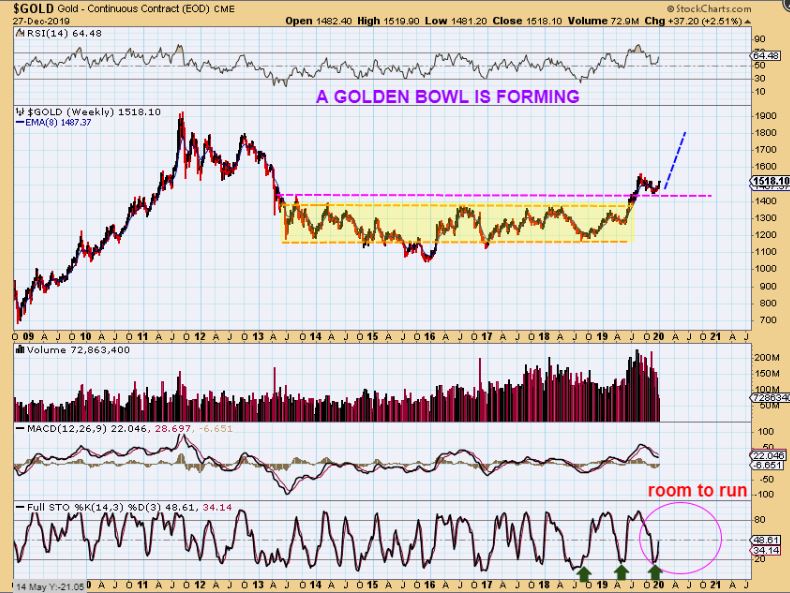
.
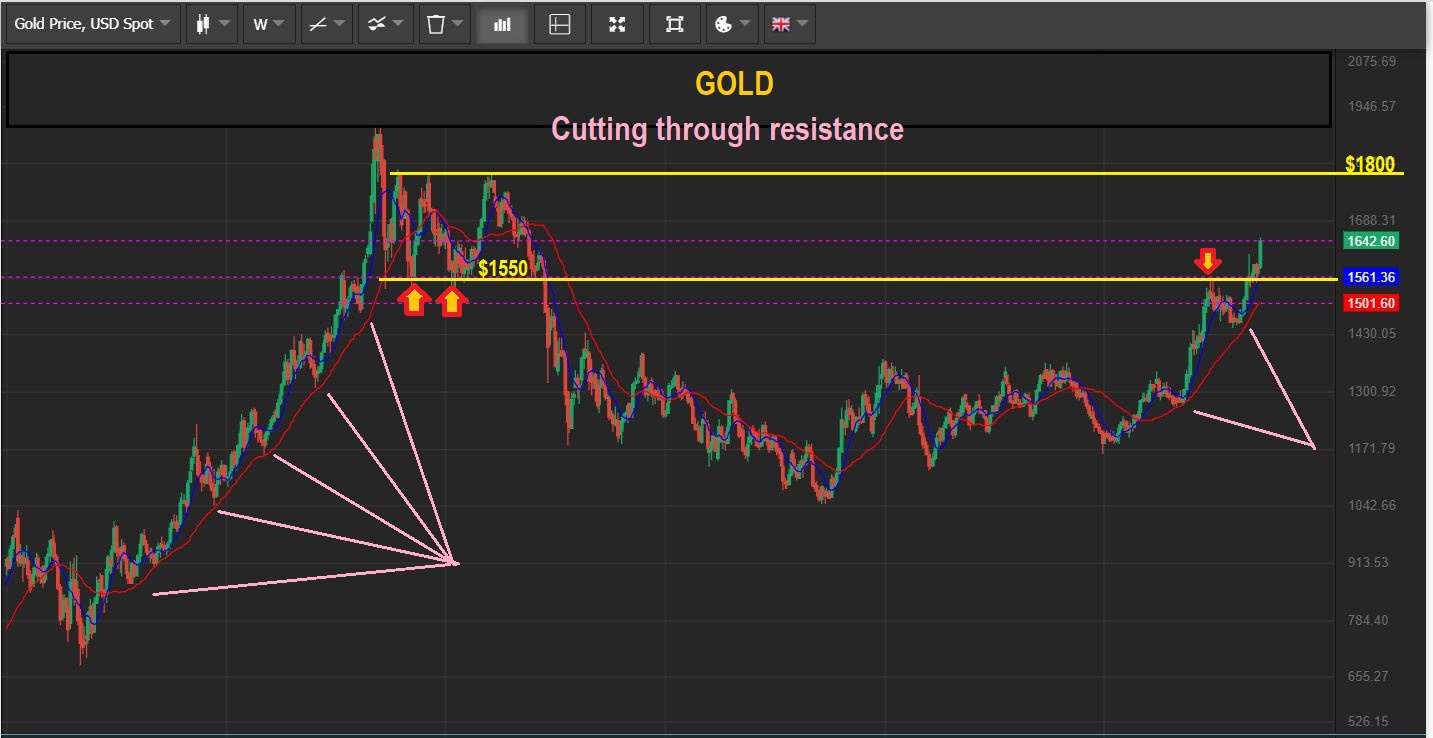
JAN 17 – There will be resistance causing choppiness, but it is still Bullish.
.
And when we ran to prior highs, it did get choppy as predicted earlier in December. It was still Bullish, and here it broke out from a triangle again. I was encouraging my readers to remain long. I posted many buy opportunities for Various Miners, some that I tweeted out too.
.
The GOLD BULL continued to act correctly with a bullish break out.
.
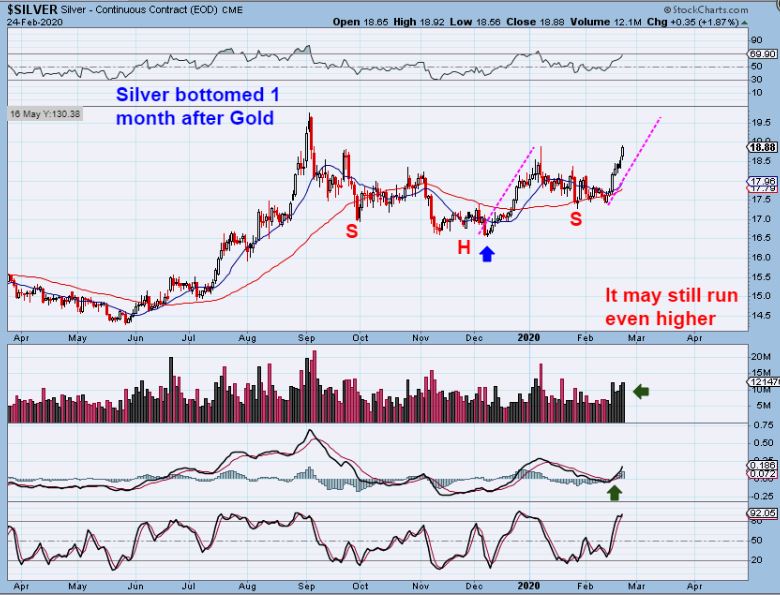
SILVER IN JANUARY was lagging Golds run, but it was still building a bullish base. CAN YOU IMAGINE SILVER STOCKS WHEN THIS BREAKS OUT? Some that we traded already doubled & tripled with Silver still inside of the base.
.
Silver at the end of January was Bullish despite the chop &drop too in my eyes. I said that I would expect to see this choppiness gradually form an inverse H&S. THAT is a bullish pattern if you see one form…
.
Well look at that! This is a current chart of Silver and the choppy inverse H&S formed.
.
AND THE MINERS? We traded many of them.
.
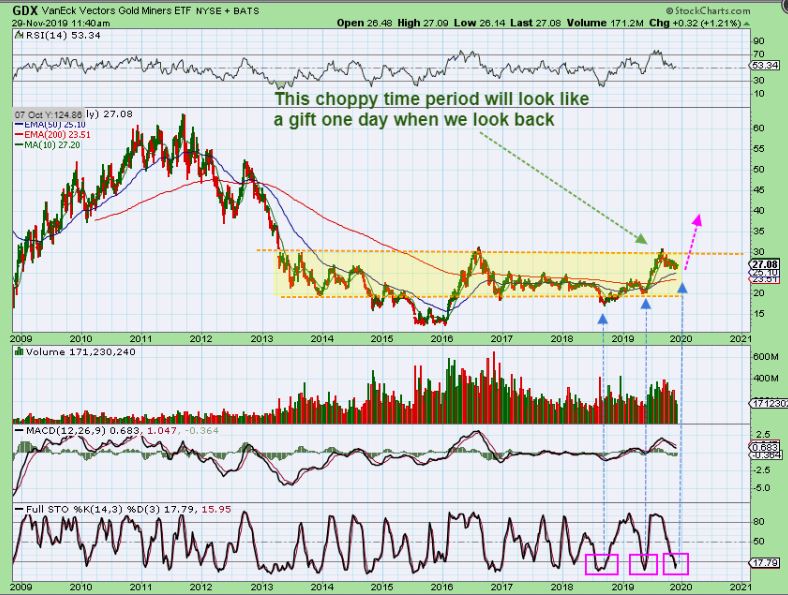
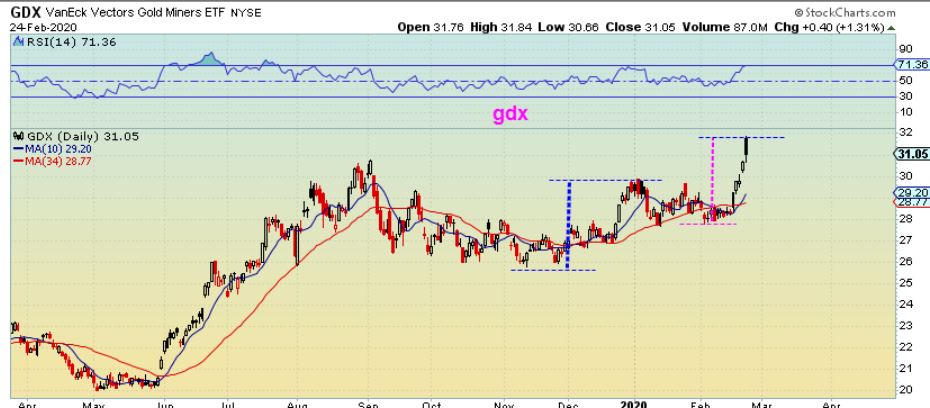
GDX was choppy as it dropped into the ICL, and I was getting a buy signal in November. I wanted to point out that that choppiness would soon be a blip in our memories in the big picture
.
.
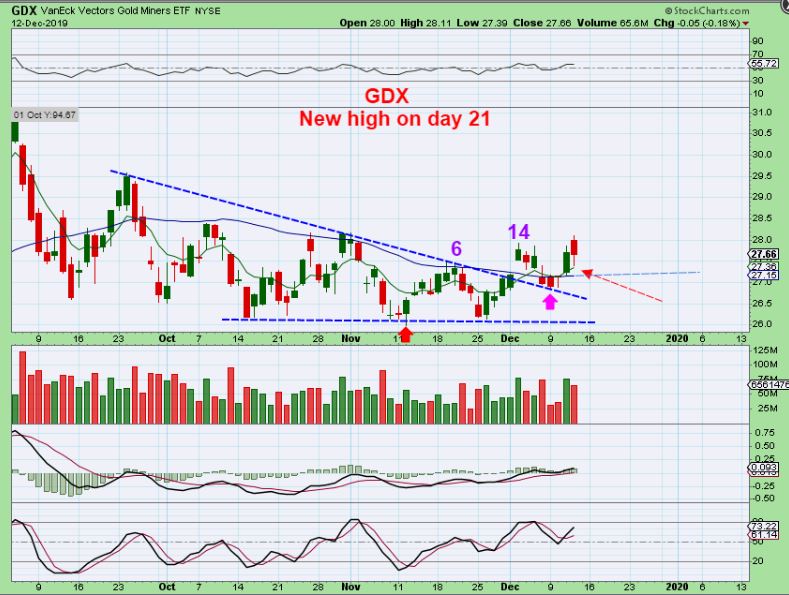
GDX – It did run from $26ish to $28, but it remained choppy and frankly it was frustrating, but as it chopped, some individual miners were running higher…
.
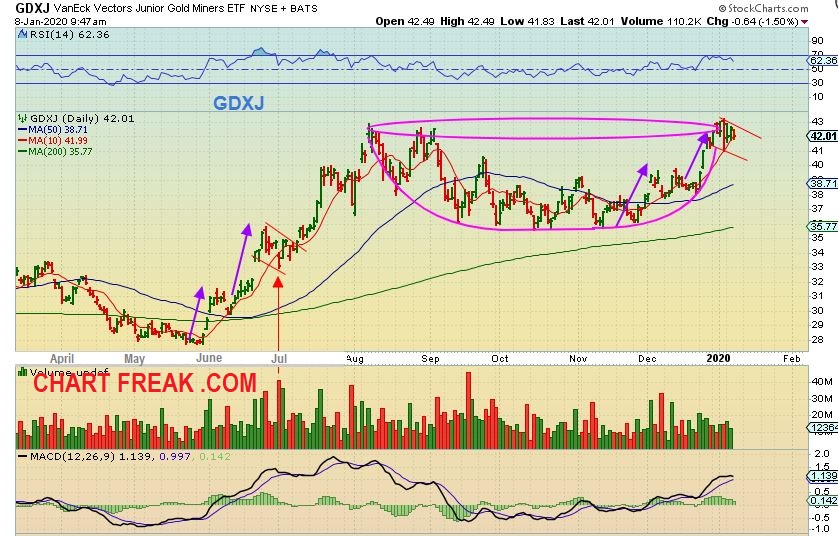
GDXJ – by the time we got into early January price ran from the November lows to prior highs. I now expected a possible handle to form, and by pointing that out here, it would help prepare my readers for possible more choppy sideways action. I also tweeted this out. Follow me at @chart_freak
.
GDX JAN 17 – Though choppy, I wanted to show that the big picture weekly remained Bullish
.
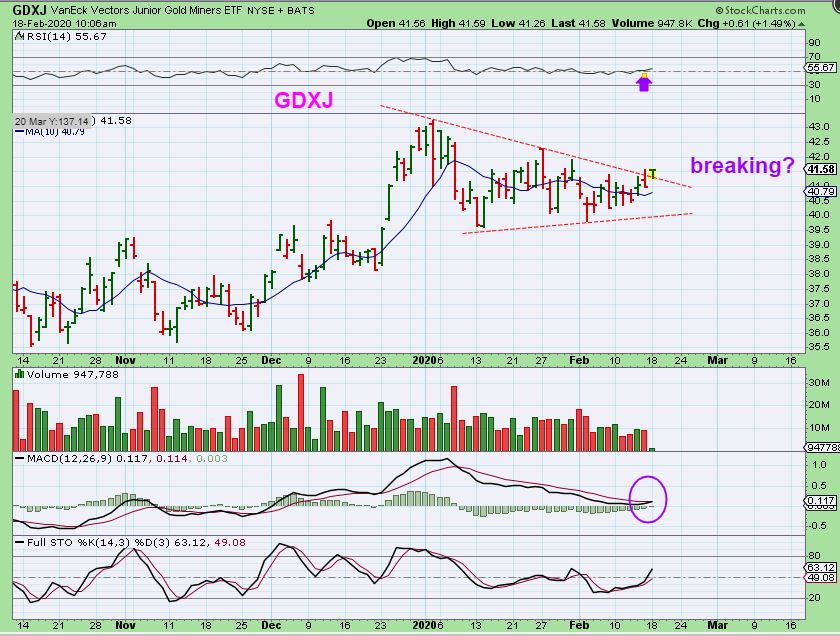
GDXJ – In mid February we finally got a break from our triangle, so I posted this at 10 a.m. in our live trading area ( an area set aside under each daily report for traders to discuss markets, share ideas, etc). This was a good place to add.
m
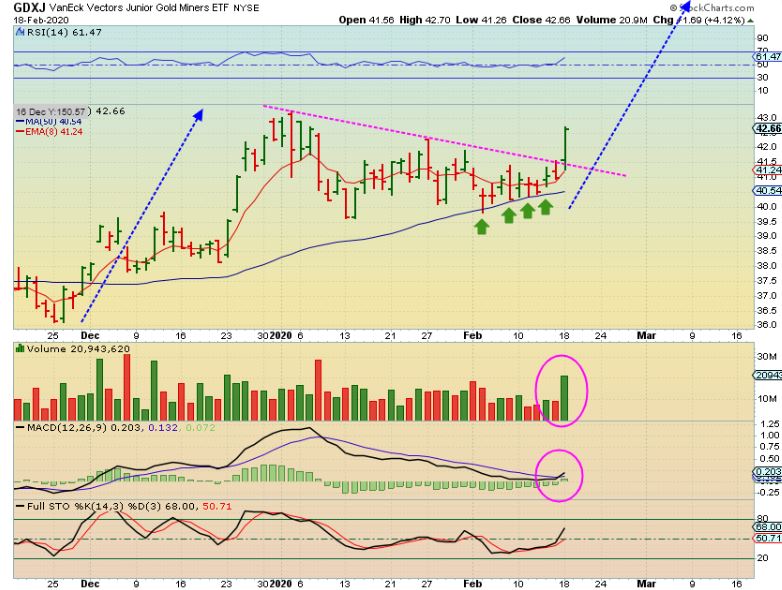
GDXJ FEB 18 – It held the 50 sma the whole time during that chop and By the close the break out was clear and volume was increasing.
.
GDX FEB 24 – Now we have actually reached a ‘measured move’. This is a conservative measure and it can stretch out higher, but for now we may see a Pause in the upside (short term pause). A DCL is actually coming due.
.
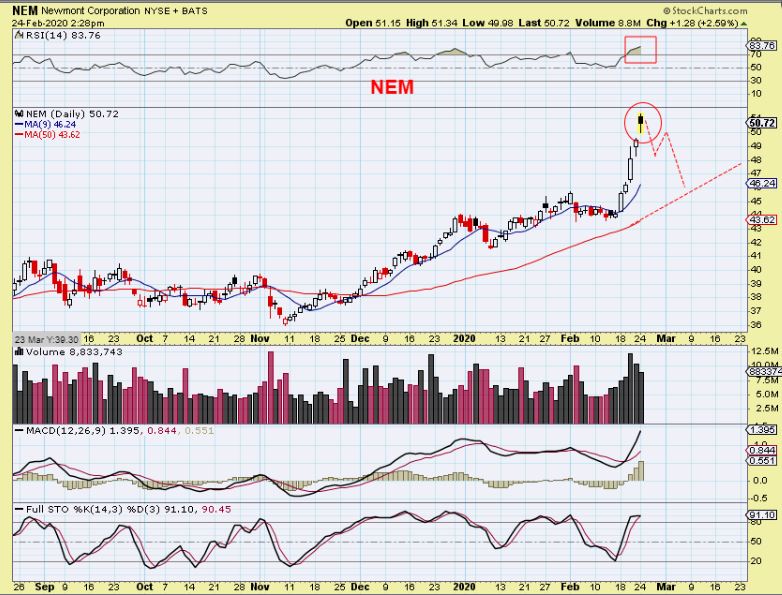
In todays premium report, I pointed out possible topping candles. Some Miners got extended , and that black spinning top may be signaling that gains can be harvested and a pull back is coming. A DCL is actually coming due in the Miners.
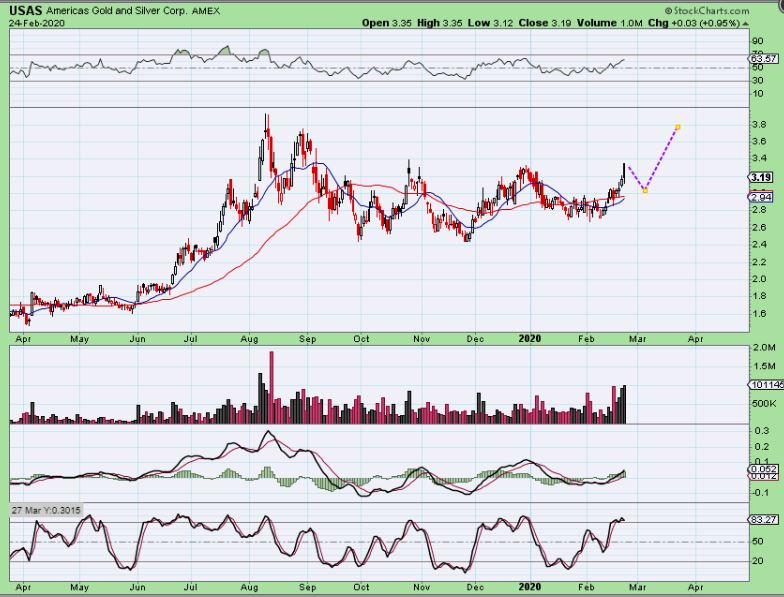
USAS –Less extended Miners may not pull back as much as others. USAS for example is a Silver stock that may run higher if Silver breaks higher. If Silver pulls back, this may do a smaller dip, since this is not as extended as other Miners. A small dip as shown is reasonable.
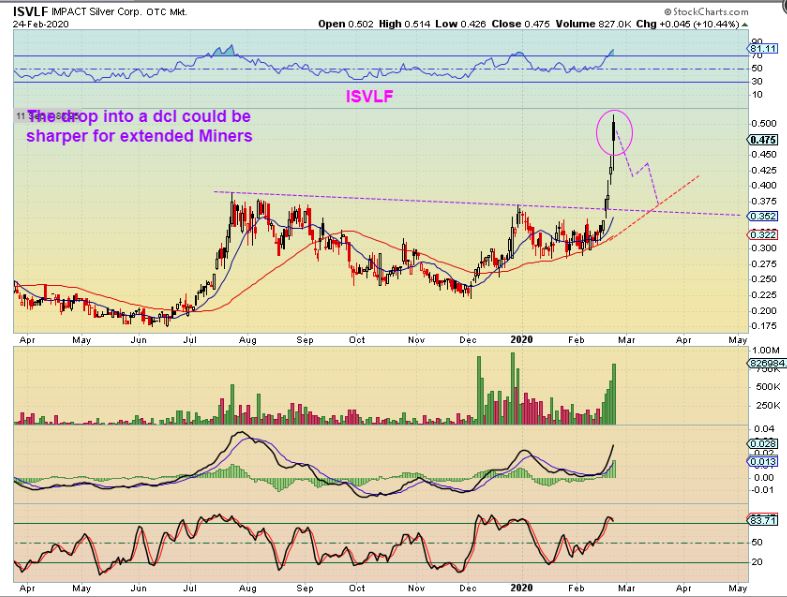
ISLVF did get extended, so a drop something like this is still possible and yet it remains bullish. This would also offer a nice buying opportunity.
,
Do you think that with your busy schedule, this kind of research may have helped assist you with your current trading style? Many people just do not have the time to review the markets daily, and that is especially true if you are looking to trade many different individual stocks. Along with TQQQ, AMD, SQ, TWTR, UBER, ZM, WORK, CRWD, and other tech companies during the bull run, we discussed & traded SOLARS, MJ STOCKS ( which were give & take as they put in their bottoming process) and of course many Miners like AUY, ELYGF, PAAS, SBGL, LGTDF, NEM, BARRICK GOLD, and more. And just to be honest, a few that made great gains for us in May through September 2019 were set up nicely, but fell apart & stopped us out more recently like HMY , SVM, CDE. What happens next? I cover it in my daily reports and I have a big weekend wrap up , usually released on Saturday.
If you are too busy to do all of the research yourself, why not sign up & try a month or maybe even a quarterly subscription? With some of the recent picks in Miners alone, your subscription would have paid for itself. If you want to know more, click the link below.
Thanks for being here at Chartfreak !
Subscription information
I want to open my recent Big Picture Review report to the Public. The following is a partial report of what I showed my readers a few days ago. Enjoy!
.
Read MoreHello and welcome back to Chartfreak. It has been a while since I did a public post, so what have we been busy with? While we have traded a variety of trade set ups, like AMD, MU, ENPH, VSLR, and other stocks like it in the General Markets, but we have also been watching the Precious Metals Sector very closely. Why? Well we caught the lows in May and rode many Miners higher into September. Some stocks like EGO, SBGL, HMY, DRD, etc doubled and tripled. After a strong rally, you often get a top and a consolidation period, so we exited leverage in August and sold many Miners in September, anticipating a consolidation period and then another strong run higher. Some individual Miners are still running nicely, like SBGL, SVM, HL, CDE, etc, so we continued to trade those, but we have been watching the correction in GDX, GDXJ, SILJ, etc closely, and I wanted to share what I am seeing now.
Monday Gold pushed a bit higher and it has closed above the 50 sma. On what would normally be a light volume week of holiday trading, GDX pushed away from the 50 sma with decent volume. We now wonder: "Is Gold about to rocket higher?" As mentioned, we have been anticipating that possibility for weeks as the sector churns sideways. The Bullish action in Miners on Monday seems to indicate that it is time to go higher and that this consolidation period will end soon.
Let's just take a look at some of the recent charts from past reports along with the current set ups, and discuss further what we have been looking for.
Read More.
I want to open up a part of the premium report that my subscribers received this morning to the Public. We are waiting on a FOMC Decision and things often get volatile around that time, so I wanted to share some interesting observations that I have with my readers. After discussing the General Markets and Oil, the report continued with these thoughts...
.
USD - My unbiased look at the USD has me thinking that it looks like it wants to go higher short term. If the Fed DOES NOT cut rates, the USD could continue a little higher. However the 50sma could stop the dollars rise because, ...
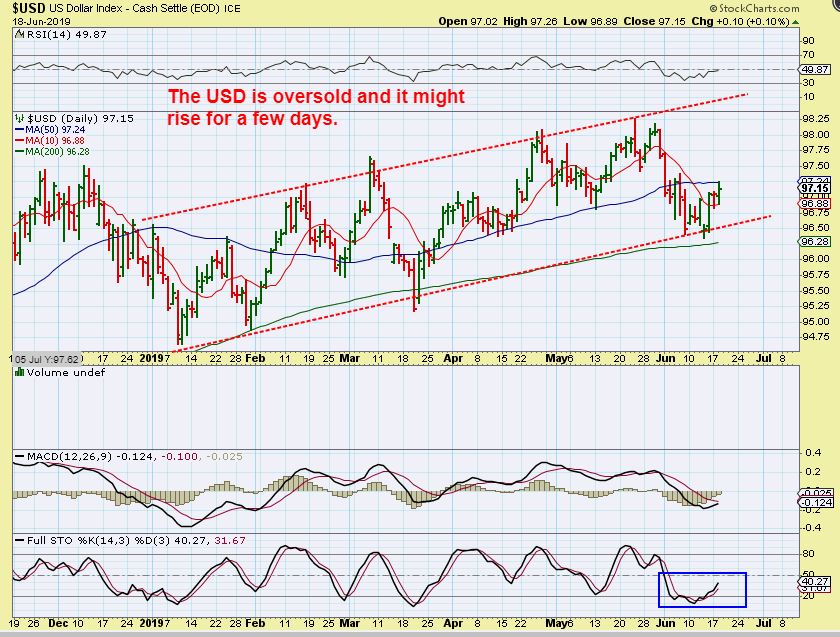
Read More.
I am opening up part of the Big Picture Weekend Report to the Public. During the week, I focus my daily reports on daily action in various sectors of the market. I then also may offer some lower risk entry points or buy set ups if they develop during pull backs. In the weekend report, however, I take a step back and focus on the Big Picture , and this is more than of that report. Enjoy!
Read More
Scroll to top