Market Turning Points And Trading
In a recent premium report, I reviewed interesting Market turning points that are showing up across various sectors. I’d like to share some of that with you now. Please note that most of this information was released in the weekend report of May 21st or within previous reports.
S&P 500 – SPX – We see a mild pullback in the General Markets after a strong rally. Not even a 38.2% retrace yet. Many advisors were becoming very bearish and pointing to a possible H&S pattern, with a big drop to come. I see that H&S pattern, but they often fail, as I was more focused on a few other areas that indicated the markets were going to break out higher, not lower.
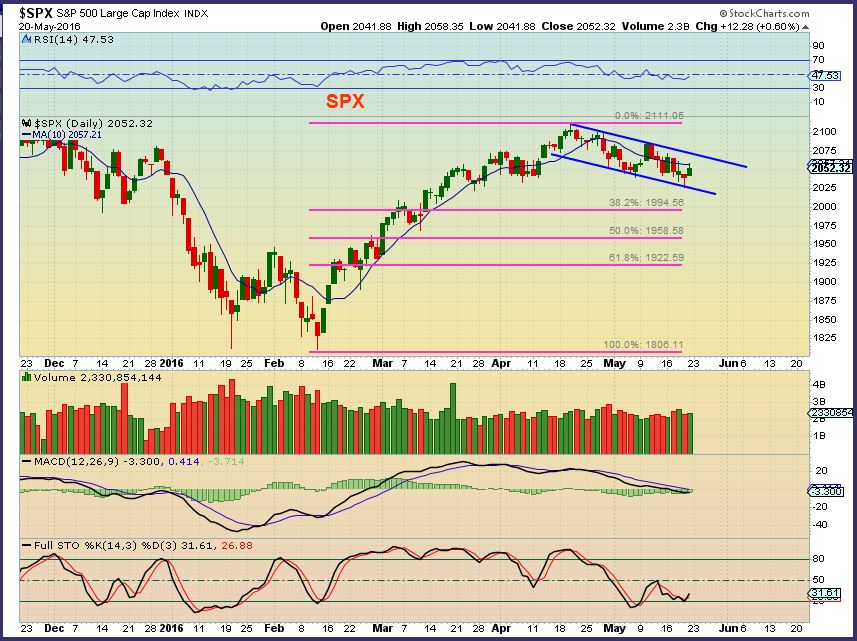
Look at the SPX here- It is actually matching an area right now that is where prior Lows were found, not tops.
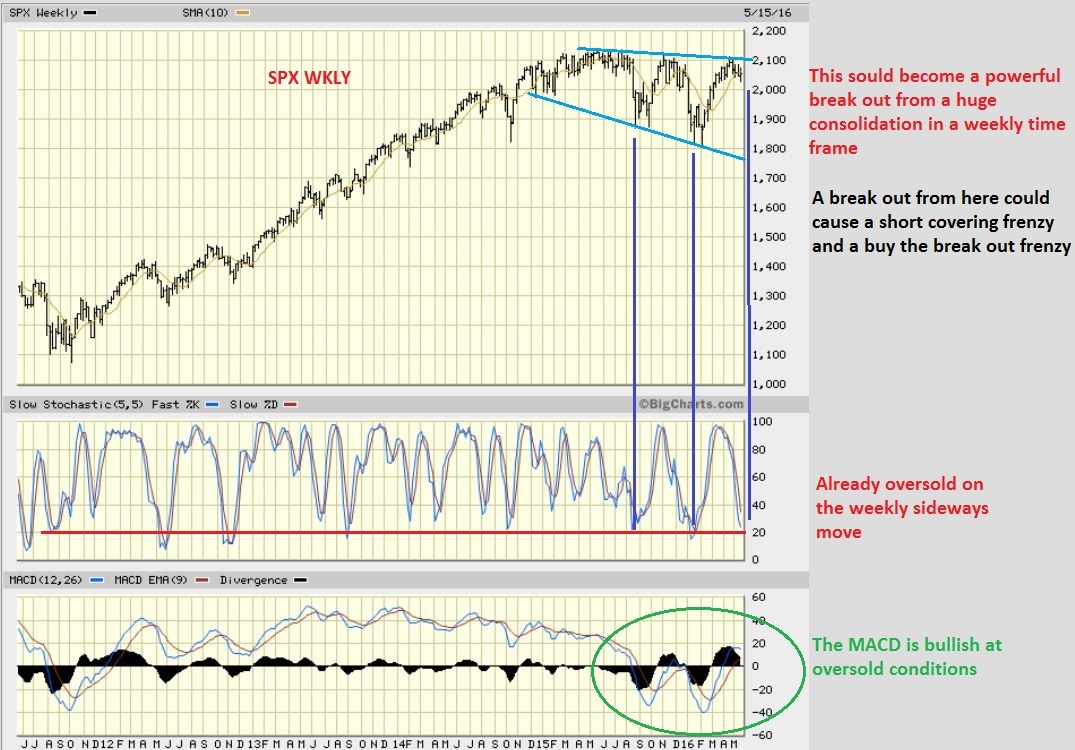
SPX WEEKLY – This weekly SPX chart is a Bullish set up. That is very interesting, because most analysts are recommending ‘Sell in May and go away’. Sentiment is bearish, people are selling holdings and even shorting the sideways move here. However, we know that group think is usually wrong. They are looking at valuations and a variety of other things that are encouraging them to go short or sell.
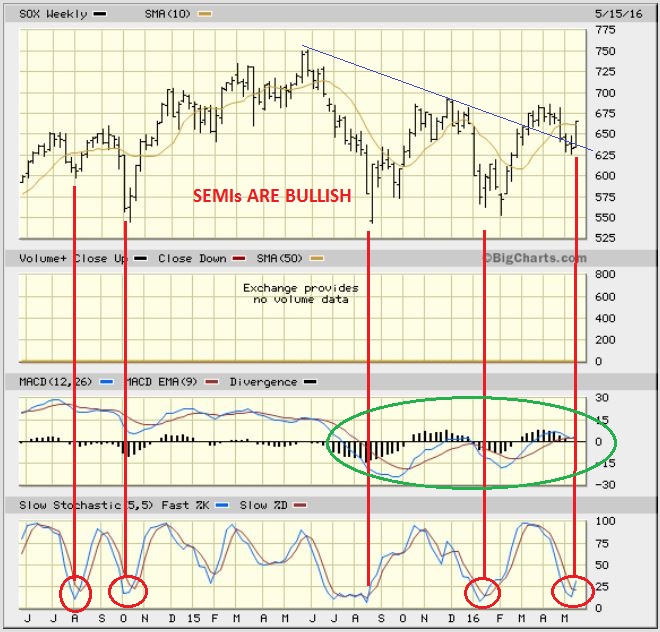
The SOX WEEKLY – Often the Semi’s lead the markets, and this is not leading the markets lower. The SOX index is bullish and oversold on a weekly basis.
QQQ- This also looks like it wants to eventually break out, maybe sooner than later.
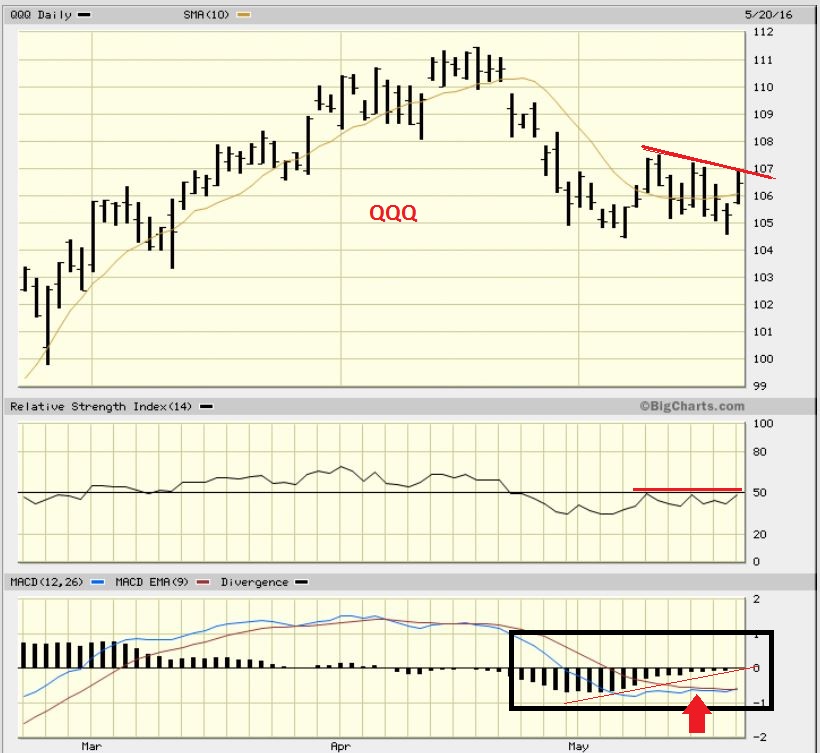
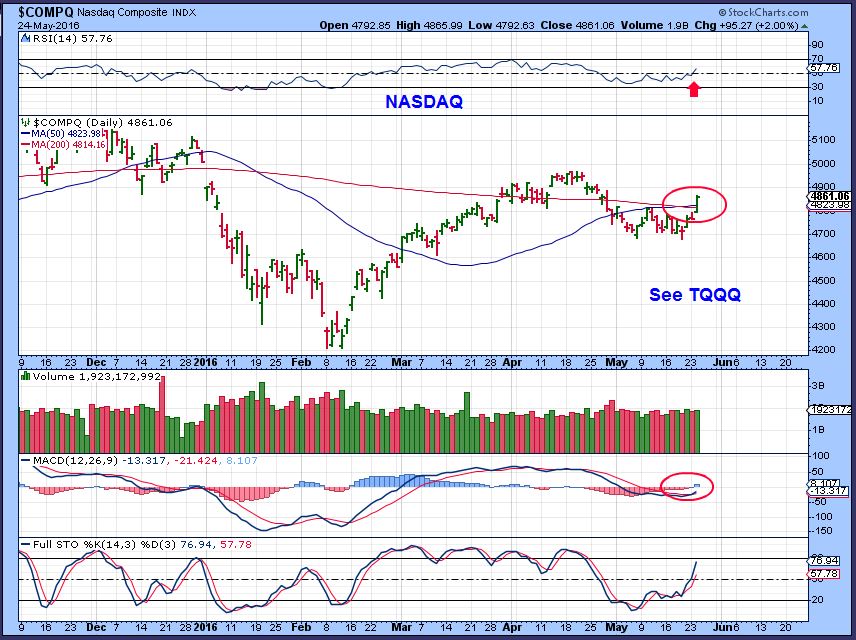
This was the NASDAQ as of May 24, and this is bullish.
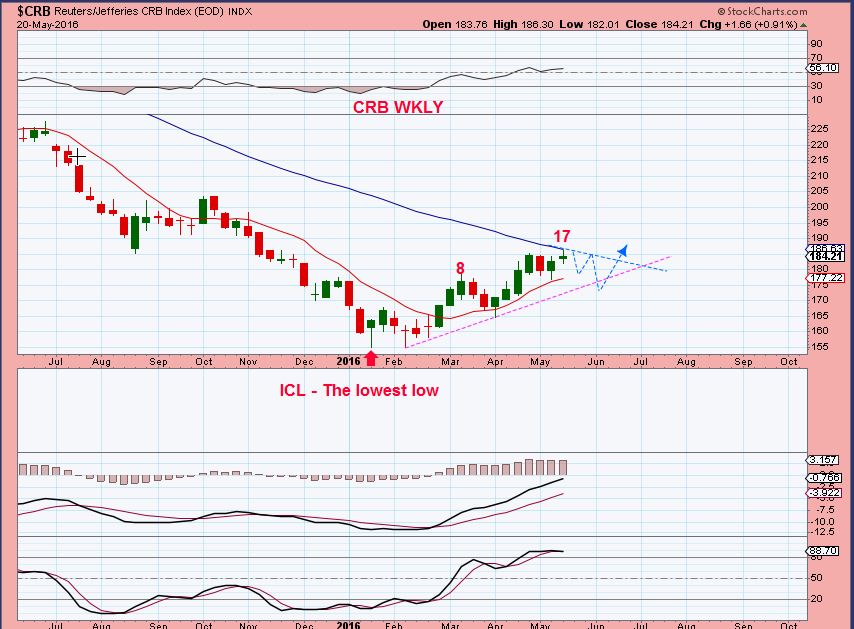
I plotted a measured move and was expecting a low in the $26 area and had pointed that out on a separate chart. This chart was pointing out the longer term support area backing that number up and showing divergence. I expected a rally in oil.
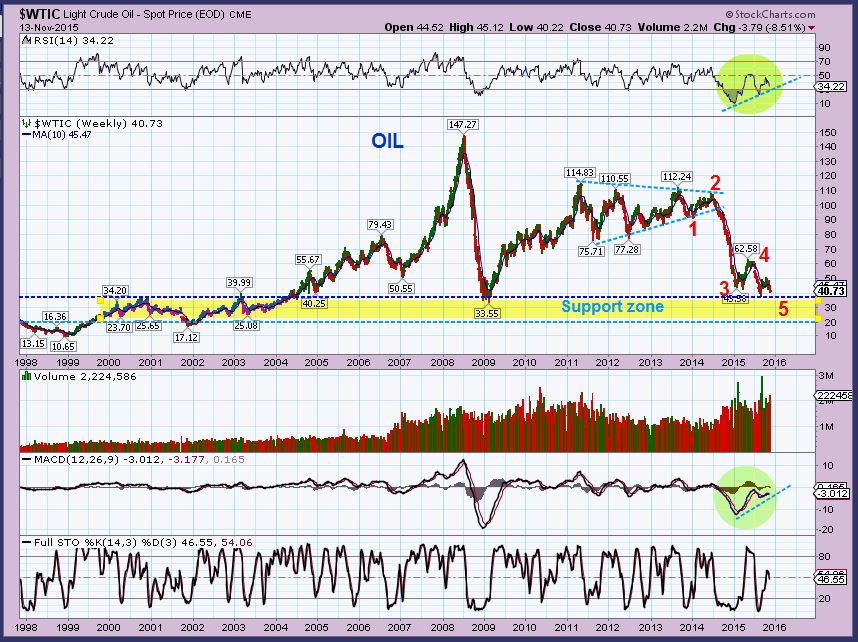
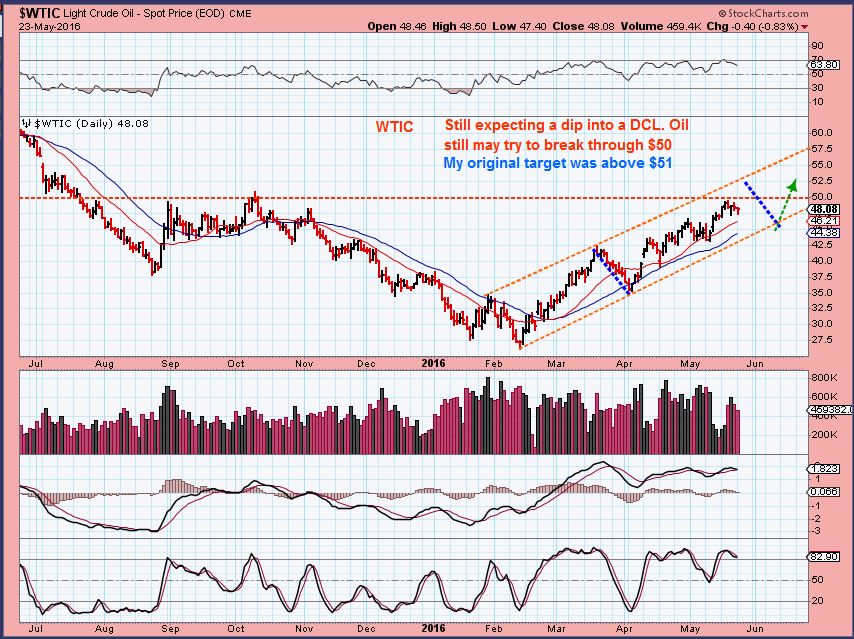
I firmly believe that the lows are in for oil. I’ve been targeting possibly a move above $51 all along, and then a dip into a daily cycle low. I would then expect another move higher after that.
CRB WEEKLY -I wouldn’t be surprised to see the CRB stall and pause or consolidate the recent run. This will just build energy for another push higher.
GOLD & MINERS
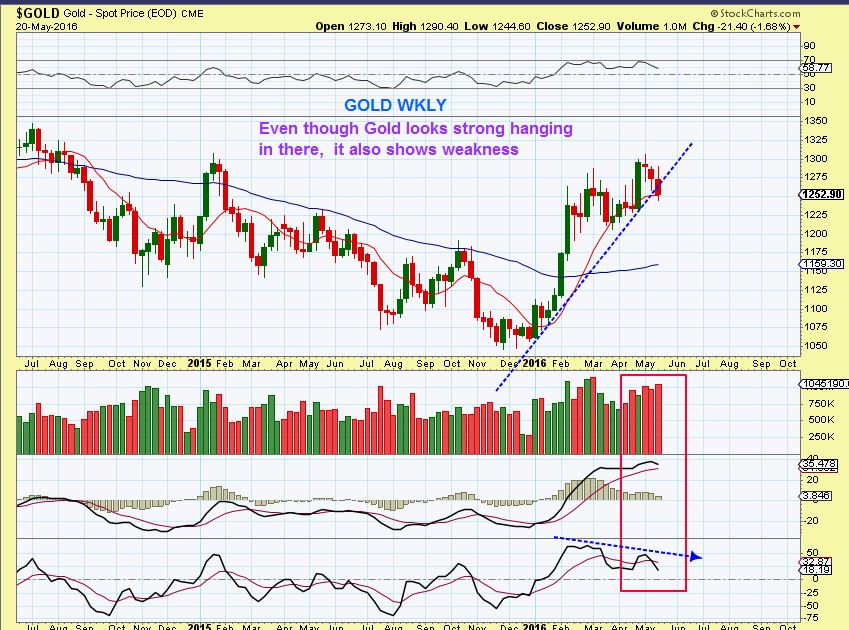
GOLD – We caught the move in Gold & Miners from Mid-January into March. I did recommend locking in some gains by taking partial profits, and expecting a pullback to offer another buying opportunity. This has been a very strong run higher in Miners. Now I feel that Gold is going to drop into a Cycle Low.
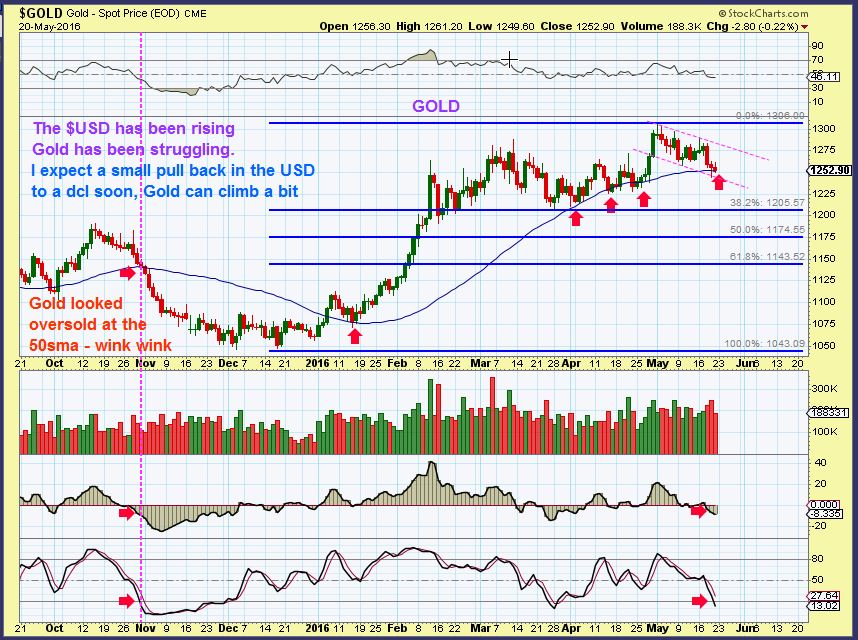
GOLD WKLY – We see a break of the weekly trend line, and I think this is the start of the drop in Gold prices.
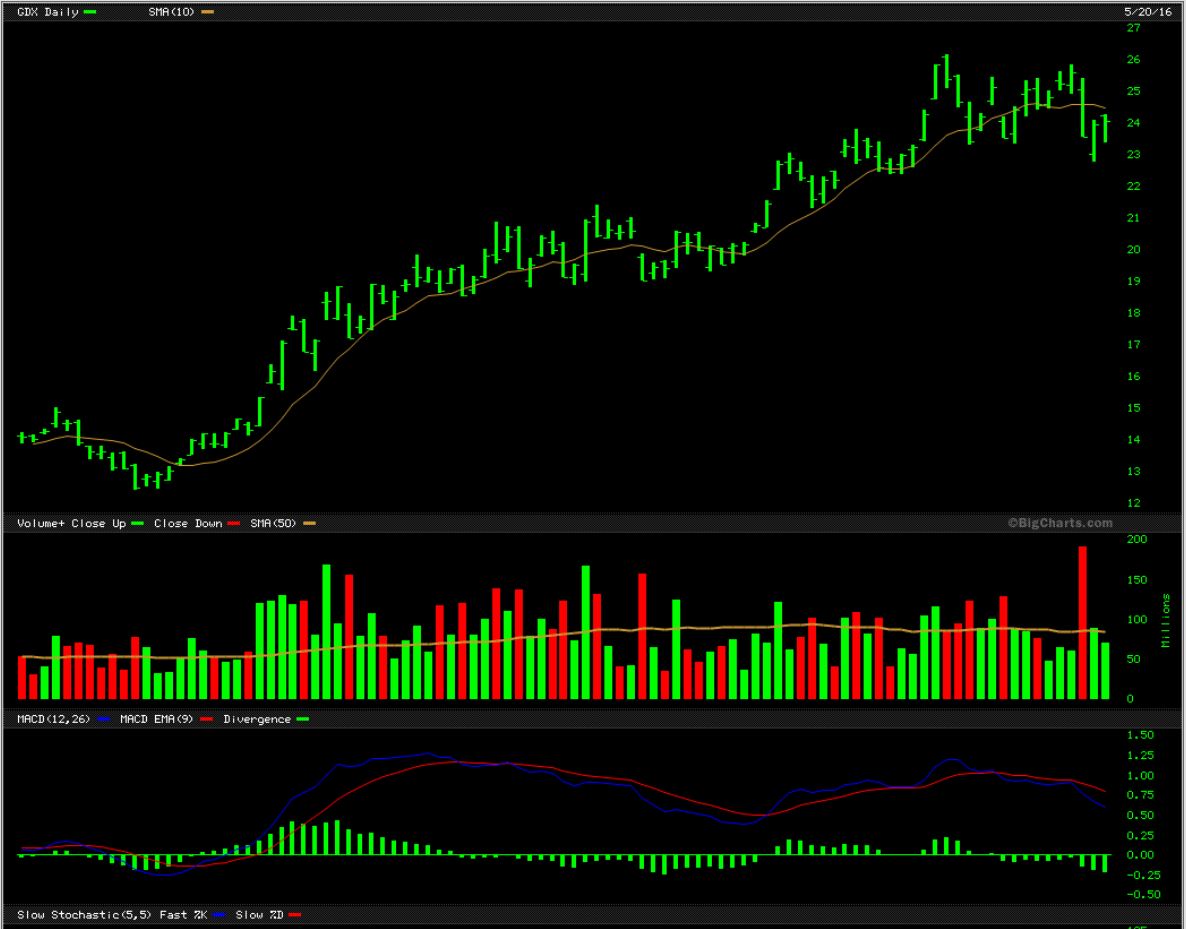
GDX – The GDX broke down with strong volume 3 days ago. Look at charts of DUST & JDST. They had HUGE volume on the Wednesday that the Fed Minutes were released, and in the past, that has marked Tops in GDX. I think we may finally have a temporary top in the miners.
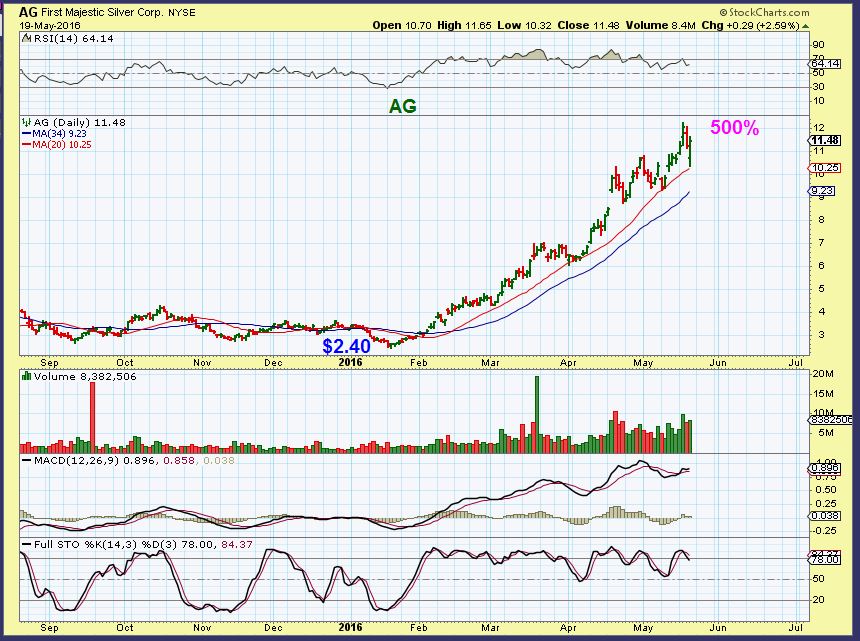
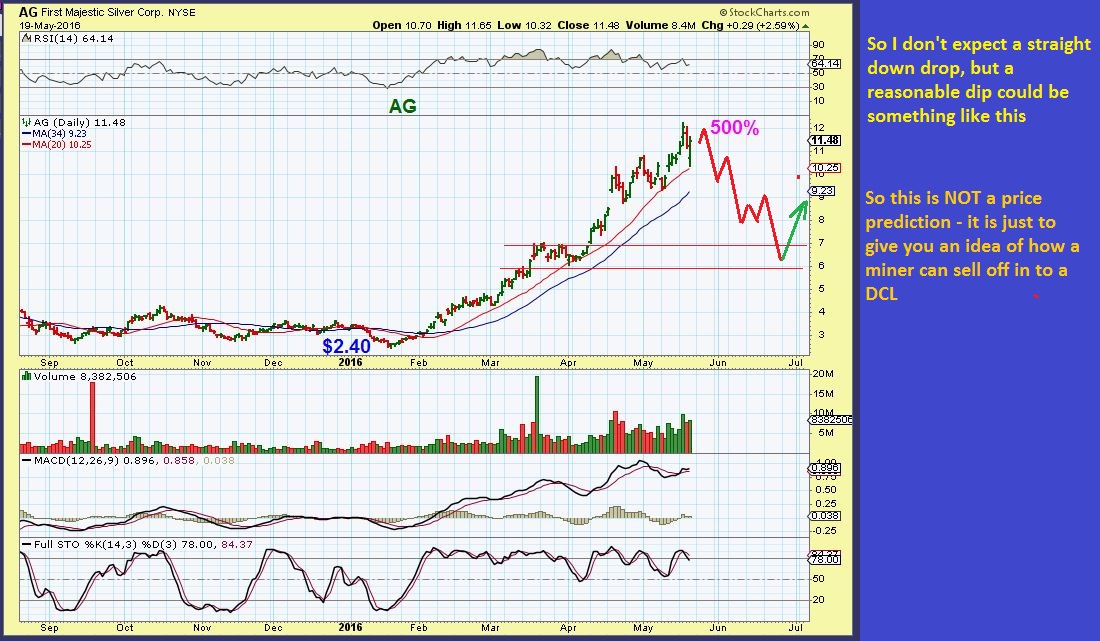
Miners have been so bullish coming out of the lows that many cannot even picture a pull back, so let’s discuss that possibility for a moment. Take a look at this run in AG for example. So strong with another bullish reversal last Thursday, could AG or other Miners realistically pull back very much?
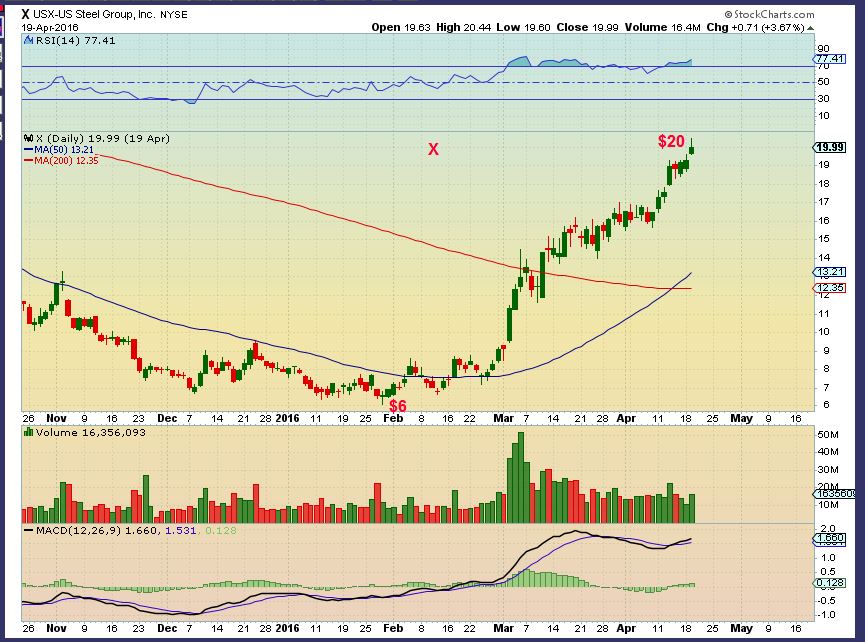
Consider this: US STEEL (X ) was a stock that looked pretty strong on its run from roughly $6 to $20+
Could a stock like X that was practically running straight up really drop all the way to the 200sma? That would be $2.91 at the 50sma.
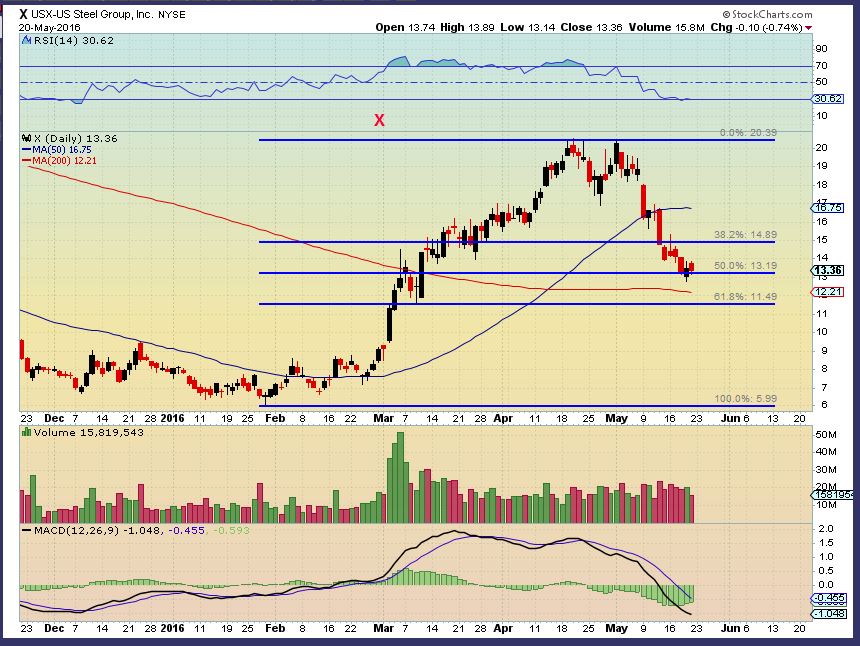
As of May 20 X had dipped below $13.00, and that’s a 50% pull back. This just shows how rapidly things can change if the selling accelerates in Miners.
So I hope this can help to give us a visualization of what some Miners could look like when they eventually start pulling back. This could offer us a much lower entry point if we can remain patient.
CYCLES AND TRADING
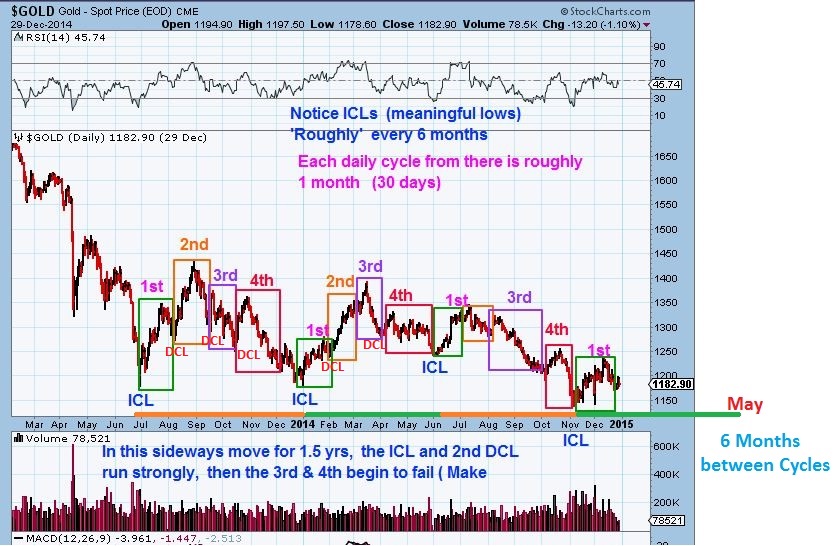
This is an old chart of gold that I use to show how these daily cycles bounced along in a bear market rally. Shown are 3 longer Intermediate Cycles (ICL to ICL) that occurred roughly every 6 months, and 4 smaller cycles within. The point that I wanted to make was that by taking some profits on the way up, and exercising patience after a strong run higher, we can wait for a buying opportunity after a normal correction takes place. I believe that Gold and Miners are experiencing that process now.
So as of May 20th, I was seeing strong opportunities with the market turning points. OIL and Commodities have been very bullish for the first few months of 2016, I expect a pullback that will lead to another run higher. Precious Metals have been VERY strong on their run from the Bear Market lows. A pull back will give us a great buying opportunity. To take advantage of these trade opportunities, I will be monitoring these moves going forward.
Chart Freak Premium
Chart Freak members receive up to 5 premium reports per week covering a wide array of markets, as this public post illustrates. Come and join the ChartFreak community as we trade the new gold bull market and various trending sectors.

~ALEX
Break Through 
 From Break Through To Follow Through
Scroll to top