
Goldman Sacks sees higher prices in Oil. Finally.
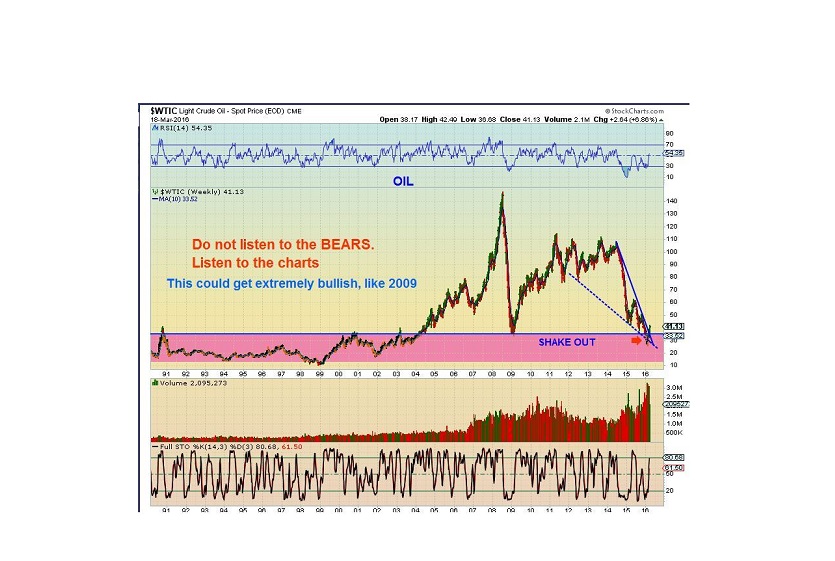
Using charts like the one below, you may recall that I had been call for a low in Oil in early 2016 and snap back rally in Oil and Energy stocks. Since that time, many analysts still called for another price crash, and that includes Goldman Sachs . Is this important? It is if you missed some of the 100%, 200% 300% gains in some of the energy stocks.
Did you see the news today about Oil by Goldman today? This was the headline.
.
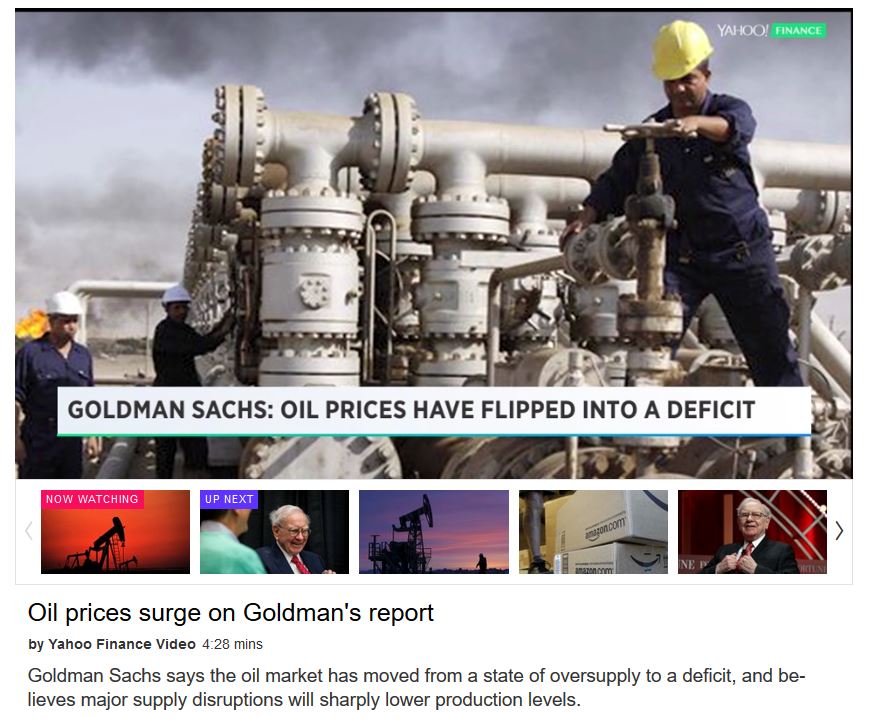
Goldman now says that they can see Oil trading near $50 . It is $47+ today, up from $26. Thats a rather late call.
It seems that the charts are actually forward looking. They seem to be 6 months ahead of the fundamentals. That is an important gap, because as mentioned, now many energy stocks are up hundreds of %.
.
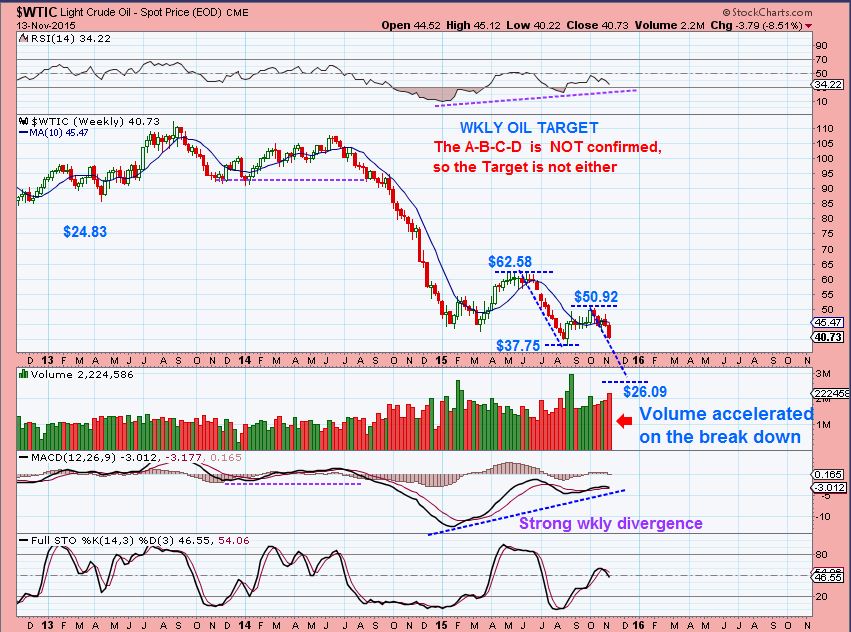
As a review, I called for Oil to bottom at $26 ( or $24 if price extends) back in November 2015. This was my weekly chart for premium members, to know what price target we could look for.
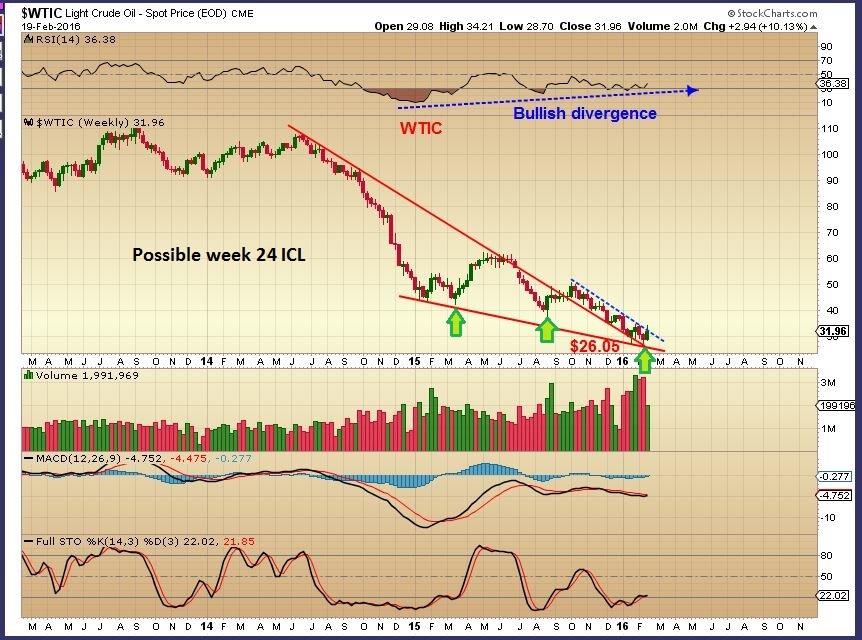
In Feb 2016, we had a Cycle count and Wedge Pattern that pointed to higher Oil Prices. We had bullish divergence and already beginning to trade Energy stocks, based on their charts. The Fundamentalists were extremely bearish, pointing to an excess of oil, and insisting that there was no way that it could rally from here. They were calling for Price in the teens.
Fast forward since then, and we at Chartfreak have been trading Energy stocks ( Or ETFs if that is ones preference). Some companies have struggled and filed for bankruptcy, while many others are doubling and tripling in price out of their lows. I encouraged buying a basket of companies to lower the risk. Also watch for their earnings and possibly buy some after their release. Lets just review a couple of these companies to see their progress.
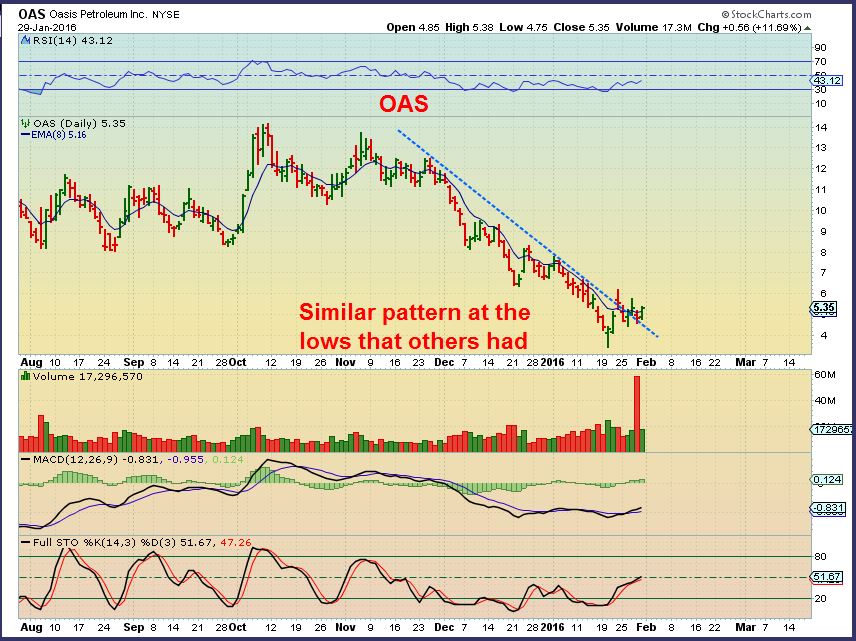
OAS Jan 29– This was a buy under $5 as it broke from a down trend.
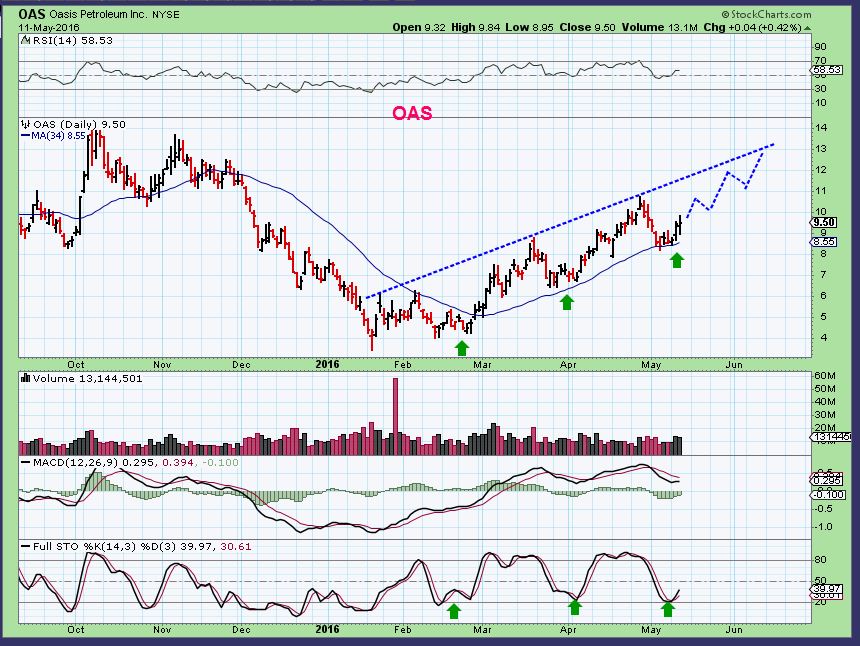
As of May 11, it hit almost $11 and pulled back.
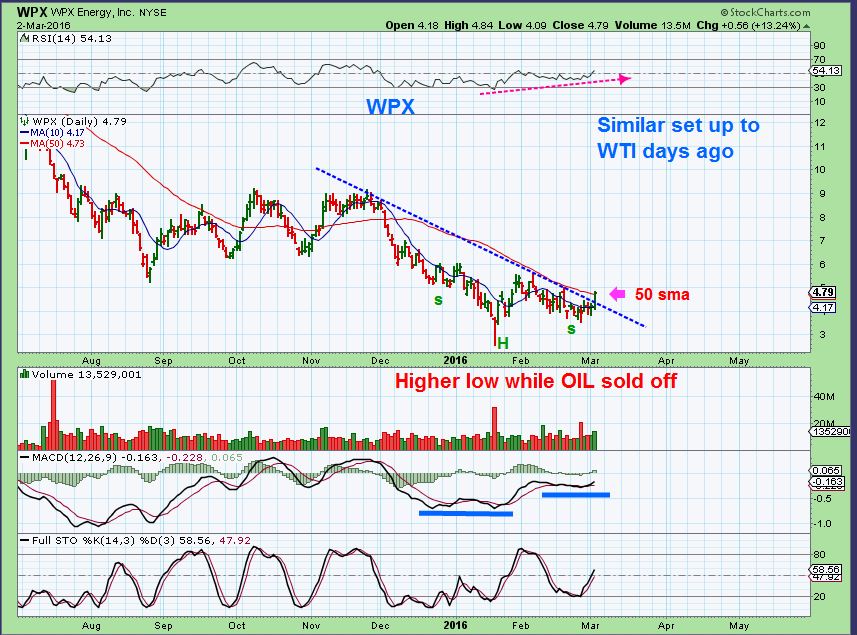
WPX – was a but under $5 too.
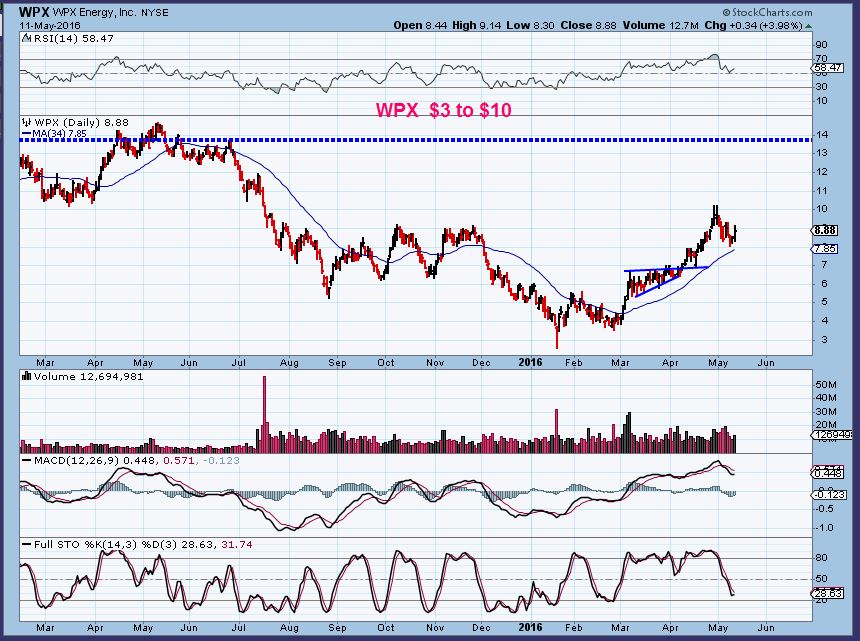
It doubled in 2 months and also pulled back recently. As I write it is back to $9.58
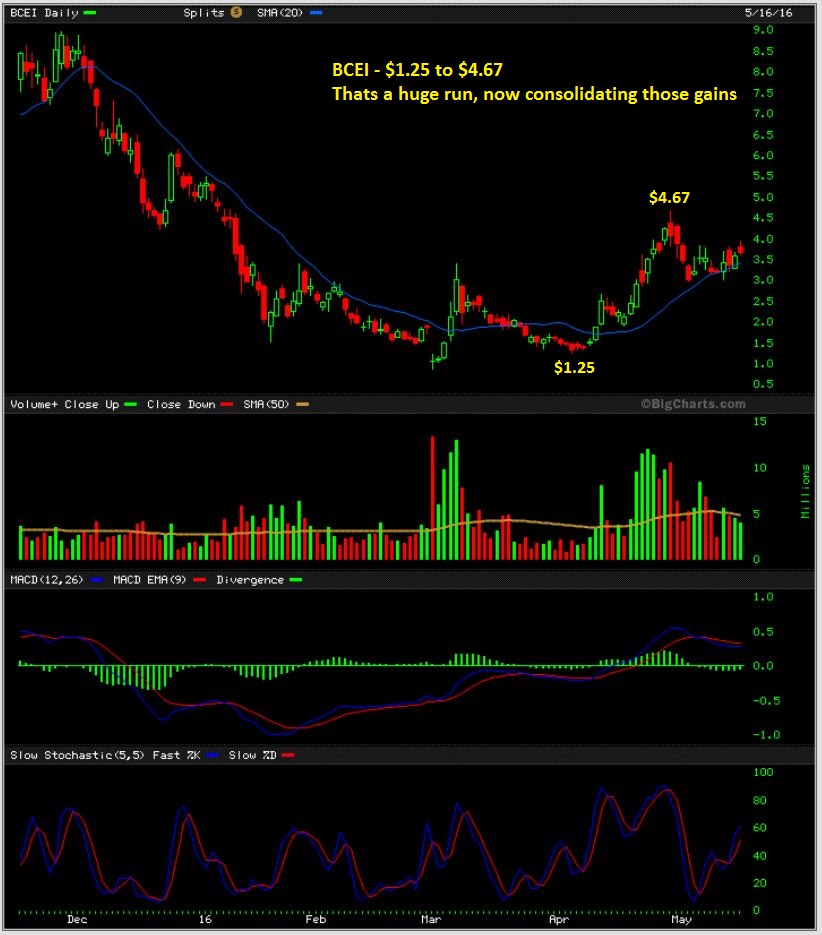
BCEI – I currently own this one and they released their earnings last week, so I continue to hold. This one had a strong surge in March and then dropped and consolidated. It then had an almost 300% run in just a couple of weeks and is now consolidating those gains. I believe that in time, this is going much higher.
As I mentioned, a few debt burdened oil companies filed for bankruptcy, but by far, many more of these Energy stocks are up 100%, 200% or more. Recognizing those lows early gave us great gains. It was the same for analysts turning Bullish on Gold now. Gold bottomed in Dec 2015 and has run higher for 6 months, and they notice that it looks bullish now? We were investing in Miners in January and made huge %- gains, even though we cut many of our positions to partial positions in March / April and turned to only trading them or holding core positions until we get a bit more of a correction.
.
With many analysts saying that Gold and OIL are now bullish, is it a good time to buy? Or is it possible that they are late to the party again and a correction from these levels could occur, offering a better entry with lower prices? That is the kind of analysis taking place here at Chartfreak, when it comes to Precious Metals and Oil/ Energy. A pullback can be an opportunity to buy a stock at a low risk entry, if you know where those levels are and where those opportunities present themselves. If you think that a second set of eyes could help you with your future trading , why not sign up for a month or a quarterly membership? A couple of good set ups could easily pay for the monthly.
.
To Sign up for ChartFreak Premium alerts and reports, click here for membership options.
.
Thanks for checking in 🙂
~ALEX

