I wanted to do a quick update on the Oil and Energy sector that was included in todays premium report. It is interesting that as we see Oil selling off toward the Aug lows and currently forming Lower Highs and lower Lows, many Energy stocks seem to be more or less holding up and basing out . Lets take a look.
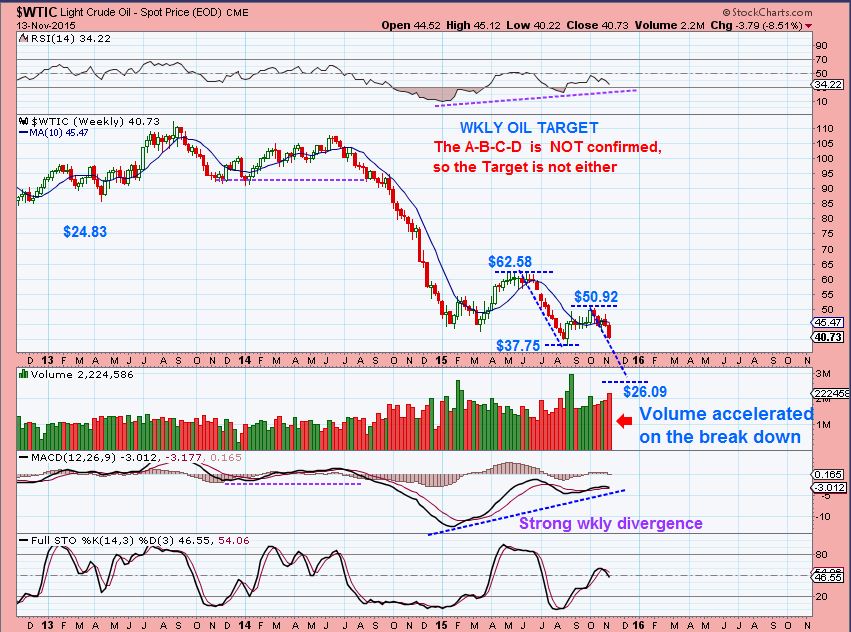
WTIC – Oil has been selling off, but it put in a reversal Monday. Will it hold? There were reports of “Oil trucks and Oil targets being bombed by France ” in response to the terrorist attack on Friday. This would be to target ISIS money ( Think “kill their oil supply”) . Wouldn’t that be Bullish for OIL? Possibly, but please be reminded that OIL is currently making lower Highs and Lower lows. Watch the Magenta line in the chart below for possible resistance when oil bounces.

From my weekend report: Notice that a longer term A-B-C-D Type move could target Oil in the high $20’s ( $26.09).
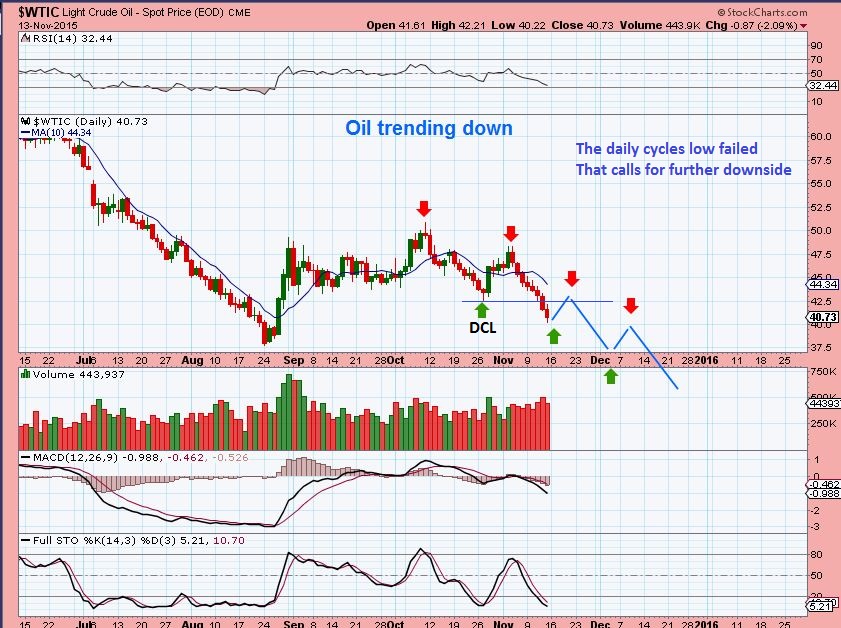
So Oils drop could stagger along something like this, with bounces along the way.
So with OIL down near August lows again, shouldn’t we would expect Energy stocks to be hurting too?
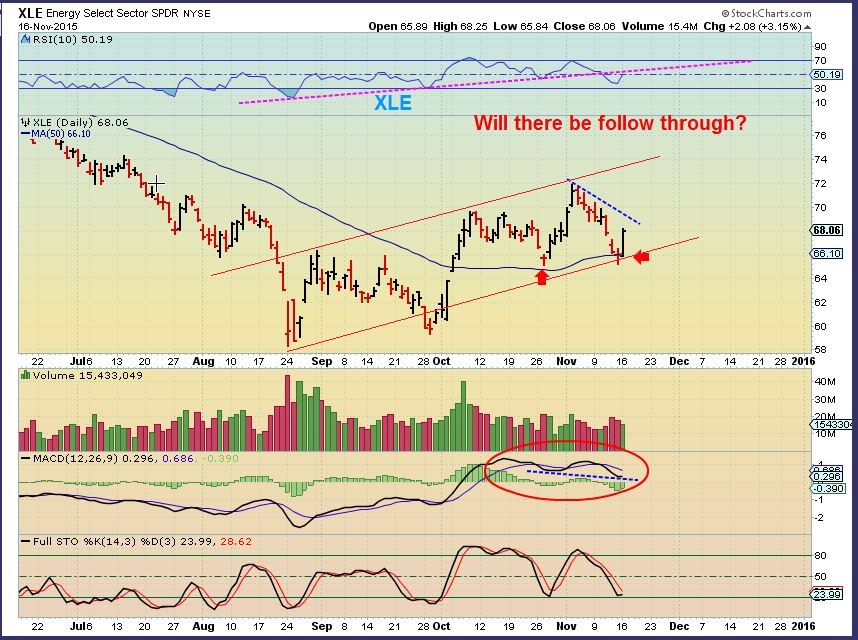
XLE – Notice that the XLE is not near the August lows like Oil. It didn’t look like it would stay above the 50sma with Oils sell off, but on Monday we saw a nice reversal at the 50sma.
I admit that it is a bit confusing seeing quite a few Energy stocks bottoming, basing out, and even looking bullish while Oil sells off. Maybe Energy stocks are sniffing out a coming bounce in oil.
So caution is still warranted with Oil making Lower Highs and Lower Lows , but some Energy stocks are looking interesting for the short term traders.
I repeat: Please see my OIL chart above again and the MAGENTA line . Then you can also take a look at some Energy charts like WG, ECA, ERF, CJES, BBG, BTE, SGY, CVI, LGCY, EXXI, ETC. Those charts and many more look quite trade-able shorter term. Buy support and sell resistance is one approach. Lets look at a few charts mentioned above …
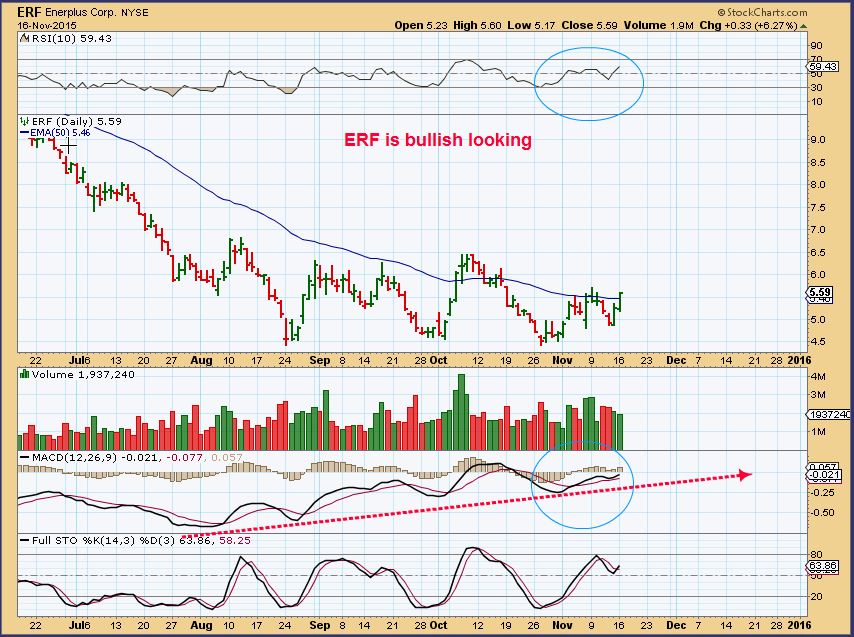
ERF – ERF moved higher Friday with OIL down and continued above the 50sma Monday.
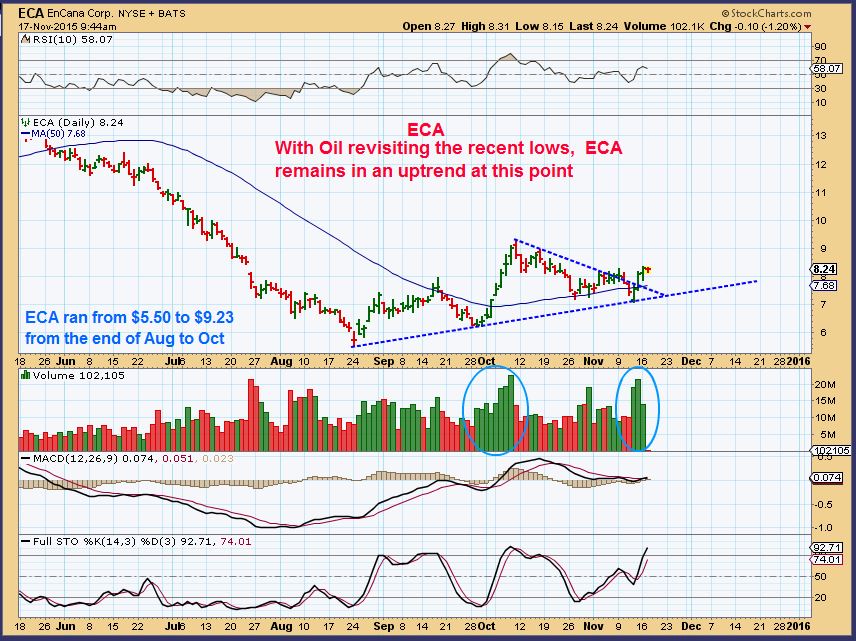
ECA – Almost ran up almost 100% from Aug to October, it continues to make higher lows here.
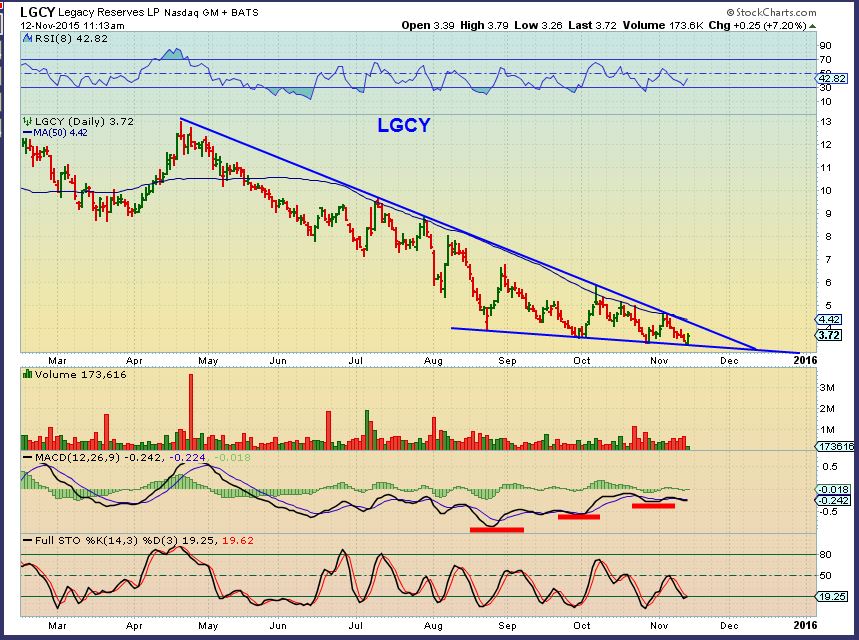
This was my longer term possibility for LGCY. It too is making lower lows, but it may be forming a bullish descending wedge longer term. It has reliable support and resistance at this point. One could monitor it going forward for a possible break out.
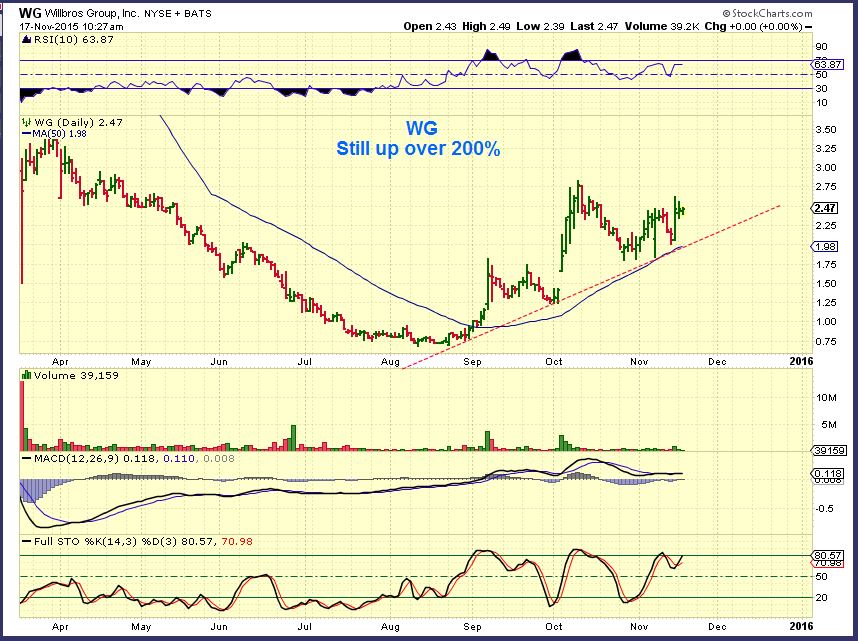
WG – After deeply selling off this spring, WG & CRK ran up over 200% from the lows. They have been consolidating gains instead of giving them all back.
So with Oil near the AUGUST lows, we see many Energy stocks and the XLE pulling back a little less. They are trade able for the nimble trader in front of his/her screen fairly regularly . If Oil recovers in the future, many of these stocks may be basing and should benefit with very strong gains over time. On the other hand, what if Oil does fulfill that A-B-C move to $26 ? Energy stocks may begin to experience additional losses, so always use stops and monitor those positions often. Along with regular market commentary, in the premium reports we have been monitoring this possible basing action in Energy and also in the Precious Metals sector. I am anticipating some meaningful lows in the coming months ( Or possibly last July for Gold? ). A monthly subscription is only $37.95 / month. If you enjoy following the type of analysis that you see here in the public section of Chartfreak, Why not join us and give us a try? I write 4 – 5 reports a week. Thanks for being here!
~ALEX
Winds Of Change 
 She’s Breaking Down…How Bad Is It?
Scroll to top