Confirmation, Time, and Targets
I have good news and bad, but the bad news isn’t really all that bad either. The good news is that we have done a great job of pinpointing and navigating the lows of what appears to be an ICL ( a deep meaningful low) in the precious metals market. The bad news is that we now have to navigate the upside and as you will see, its a bit trickier than many may expect. Lets quickly review the markets first.
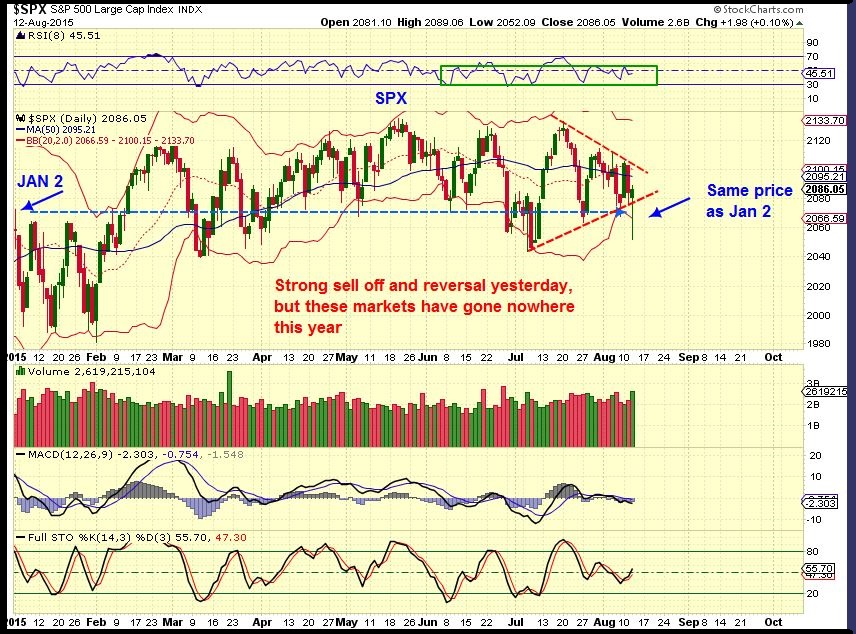
SPX– This has been no picnic for investors either. The SPX is basically flat for the entire year. Strong sell off and reversal yesterday, but can it break to new highs? It needs to be monitored. A break below the July lows in the next few weeks would be very bearish in my opinion.
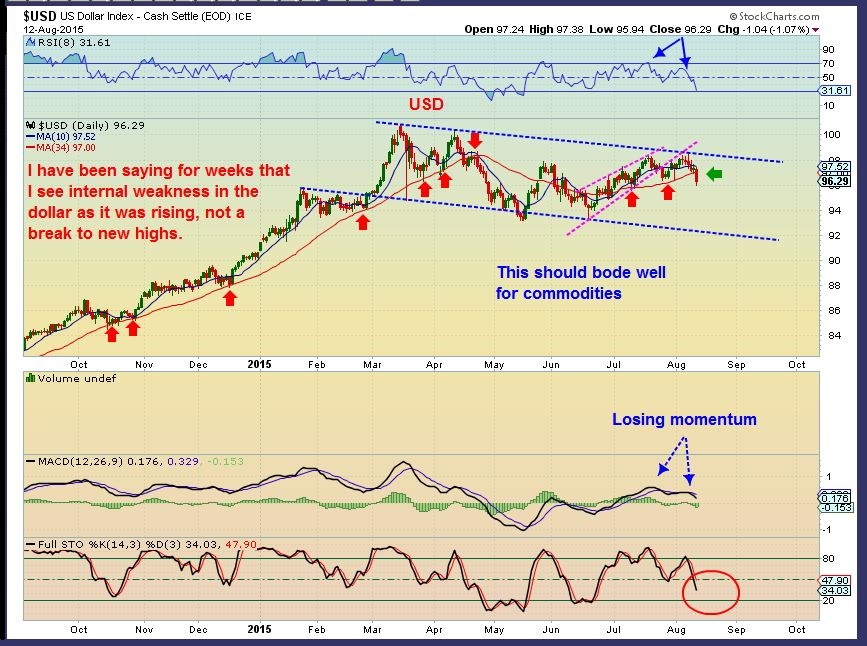
The USD looks toppy at this point. Good for commodities.
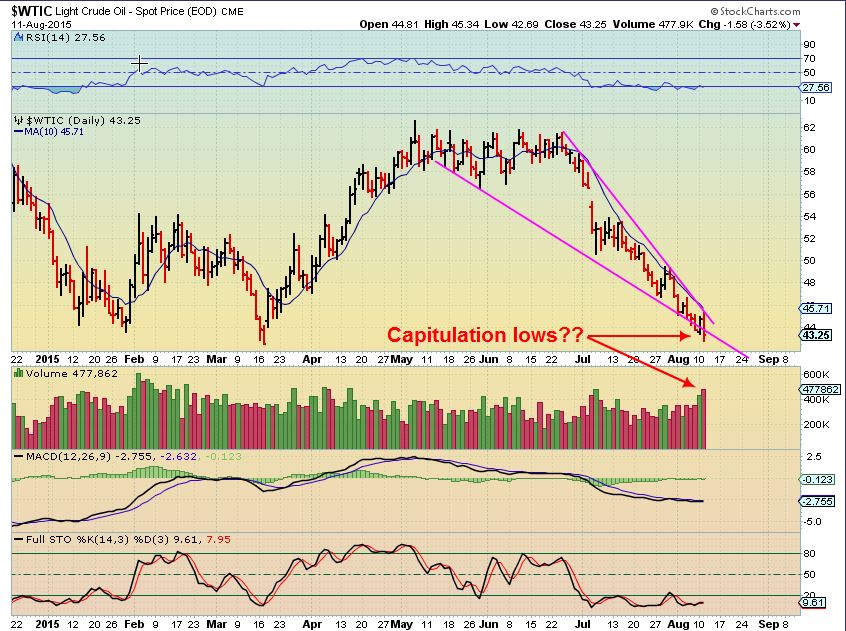
WTIC – I still believe OIL is about to bottom & run higher , based on MANY Energy/Oil stocks and this chart posted yesterday. (See Tuesdays report)
NATGAS– this actually looks like it wants to finally break upside too.
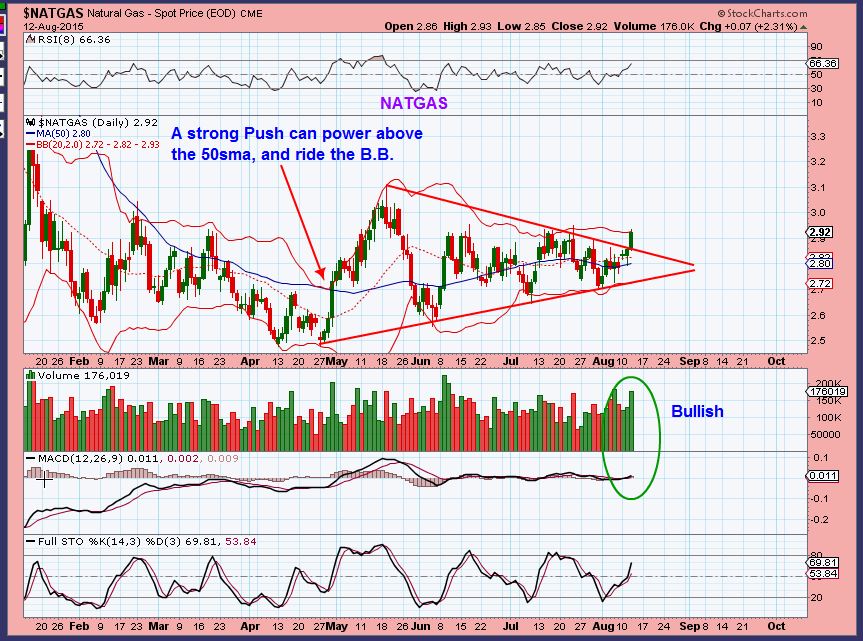
Sidenote: I want to point out how NATGAS in the above chart ran up along the Bollingerband from April lows into May. Note how this can happen because Gold & Miners will be approaching their B.B. now. I always hear people say that’s a sell signal. Is it? Was it worth it here?
GOLD, SILVER, and MINERS
(Some skim my charts and dont always read what I write. My advice here is that you want to read the below lengthy explanation)
Did you notice the opening Theme Picture? I have received many requests asking me something to the affect of , ” You got us in at the lows, how will you navigate us through the rally?” Or ” How can we trade this, I dont want to lose any gains.” I understand. Especially depending on when you chose to get in ( last Friday? Monday? Tuesday? Wednesday?) the first down day in Gold may affect people emotionally. Lets be serious. There will be pullbacks and surges higher and no one really has the ability to announce ahead of time where these “Wiggles” will show up.
We can all do some guessing ( fairly accurate in some cases) based on moving averages, prior resistance, 1-2-3-4-5 / a-b-c/ 1-2-3-4-5/ a-b-c / 1-2-3-4-5 / Fibonacci points, etc. It works and I do at times use those in my own trading, but please understand that I am not here to try to help everyone day trade their positions. The main picture that I chose for this theme is to show you that basically, the target now is a “Time period” for precious metals to run higher. Remember that “All Bottoms Look Different”? All rallies can too. The target becomes “Time”. I will explain.
GOLD WKLY – These square boxes are a few of the ICL’s from the past 2 yrs. They go from lows to peak in ‘roughly’ 2 or 2+ months. lets say 8 weeks. NOT STRAIGHT UP by any means, but ICL to PEAK is 2 months.
1. Notice that some ran higher week after week after week.
2. Some ran up and then went sideways or had ‘wiggles’ along the way
3. again noteworthy that from low to Peak, 2+ months was the ride, except May-July 2014. Straight up 6 weeks, no wkly pullback.
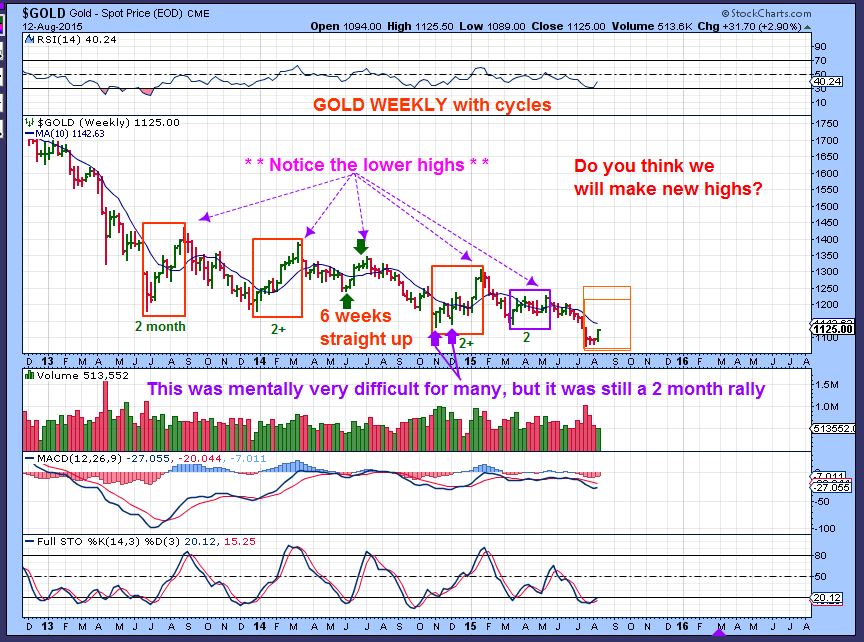
LESSON:
Can you tell me what kind of rally is about to unfold? We have extreme C.O.T. readings, readings not seen since 2001 lows? What if I “Guess” and tell you that we are near the Bollinger band, sell today & buy a pullback. THEN we get this type of short covering like 2014? That “Down day ” on June 16 was only down pennies. No one could get back in without feeling like they were chasing & buying a top, but it ran on & on & on. We’d be at the Blue arrow now.
Lesson 2:
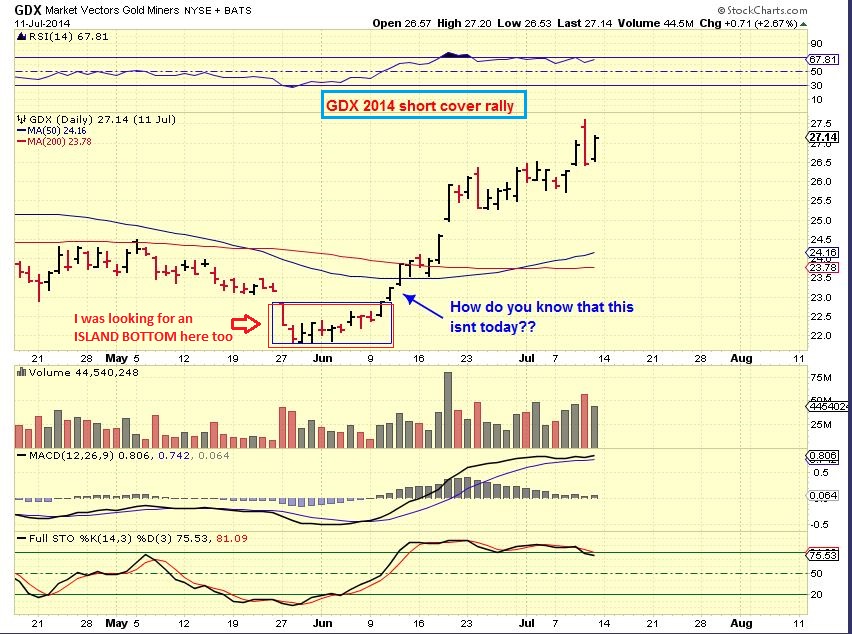
GDX Daily Cycles – They are roughly 20ish to 30ish days in length now. Its hard to judge when the Middle of the cycle will occur, but that might be the ‘peak’ of the 1st daily cycle. Some tell me that want to sell there and re-enter at the daily cycle low. Why? They remember last NOV to DEC 1st daily cycle (see below magenta arrow). It ran up & dipped right back down. That is your choice, and it might work out if we get a daily cycle like last November. Also please note however, that was really tough to trade successfully.
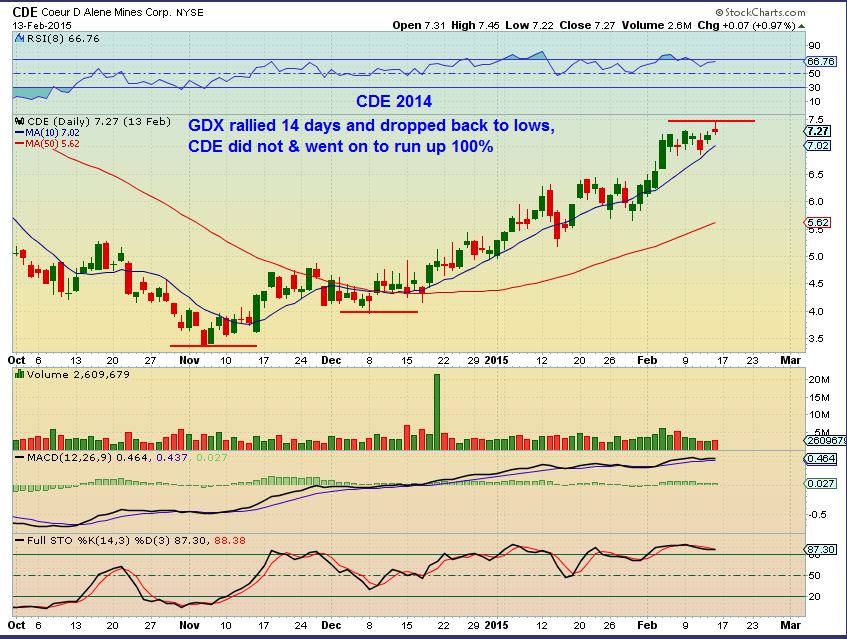
1. GDX did run higher for 14 days.
2. It tagged the 50sma & dropped from there
3. Actually rallied higher to the 50sma again ( would you have re-bought then?).
4. GDX then Fell back to the real dcl. “Shake out” style.
5. IF YOU SIMPLY HELD for 2+ months, you caught lows to the peak (Magenta box). The second daily cycle was explosive. SIMPLY HOLDING DID NOT WORK FOR JNUG !
6. The ICL in June- Aug 2014 ( Blue Box) is the example of selling the first daily cycle NOT working out at all.
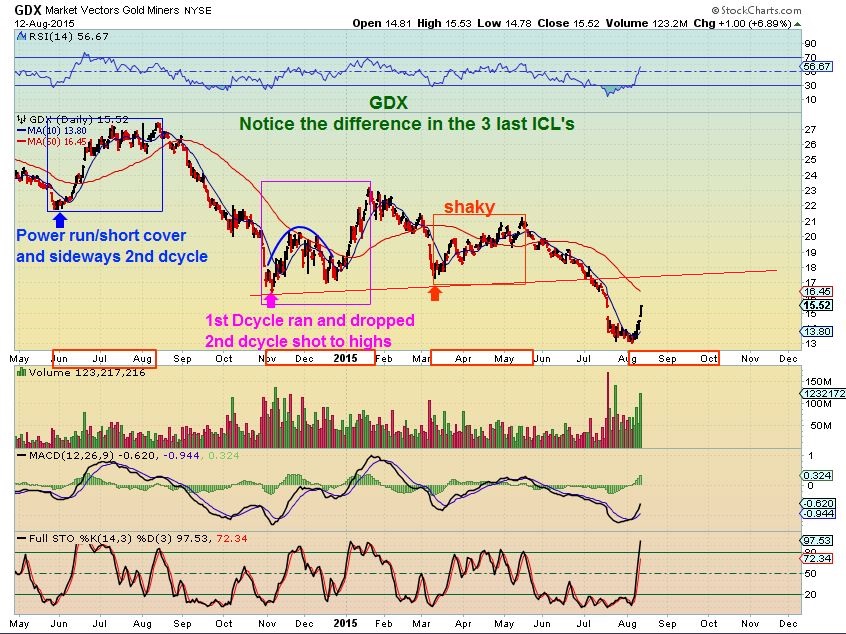
Did you notice on the above chart that the 3 ICL’s and Cycles shown are all different? One screams higher, the 2nd one bounces in the 1st daily cycle and then screams higher, The 3rd meanders higher, shaky & rather untrade-able. But they ALL go from ICL to peak in about 2=Months. The TARGET is TIME.
.
.
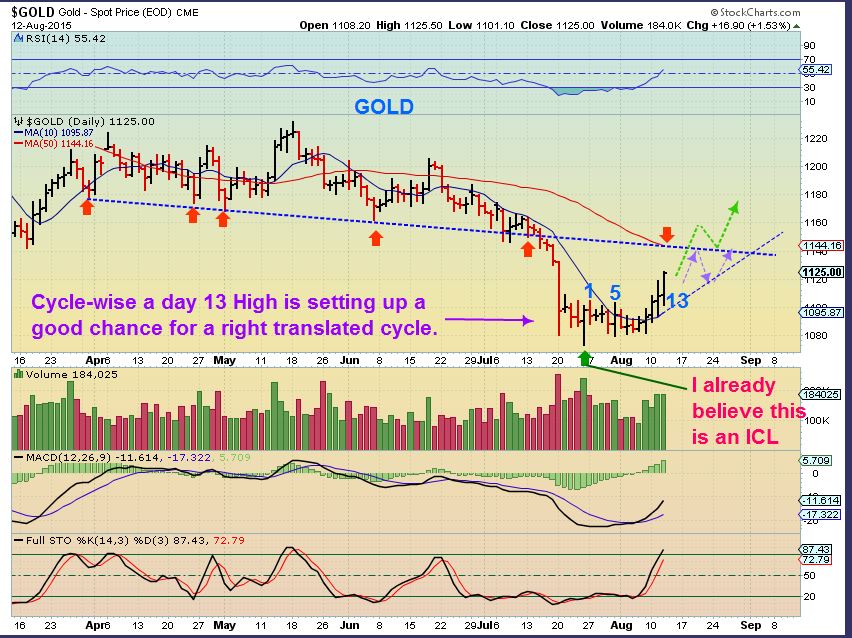
So back to GOLD– Gold is on day 13 (?). I question this because in the past I have counted a move out of a triangle formation differently, and this may apply. Miners are on day 5 if you use GDX. So basically …
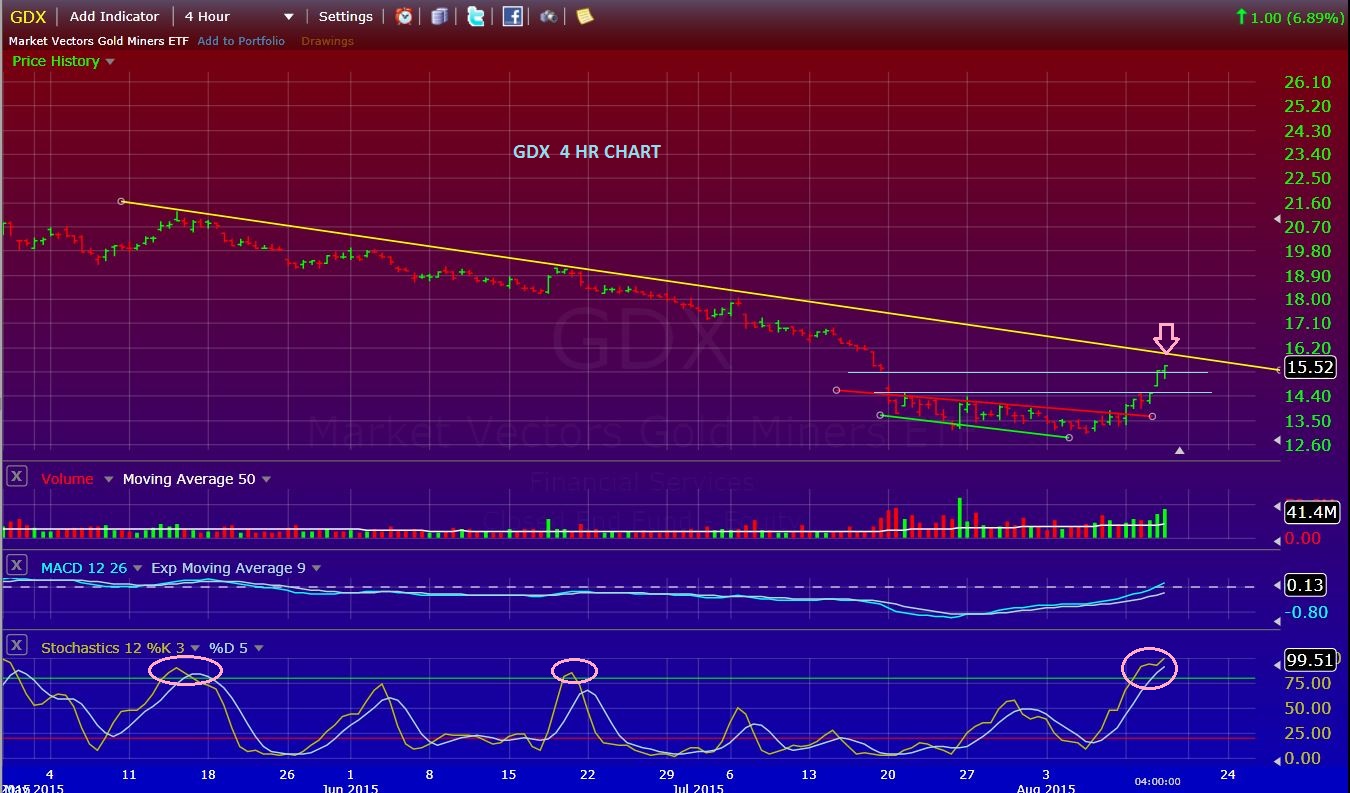
1. We could hit resistance and drop or go sideways and break through later (purple arrow).
2. Strongly burst through and maybe back test later (Green Arrow).
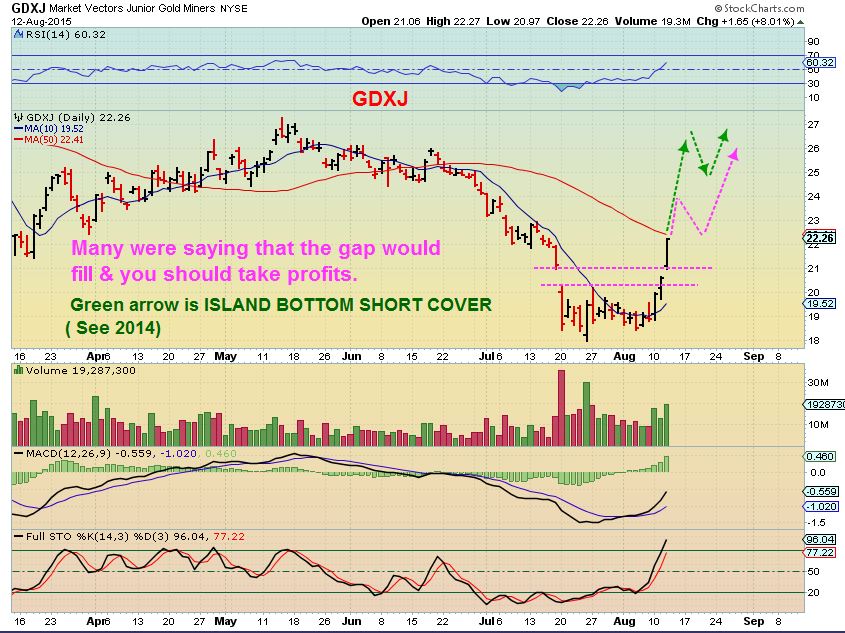
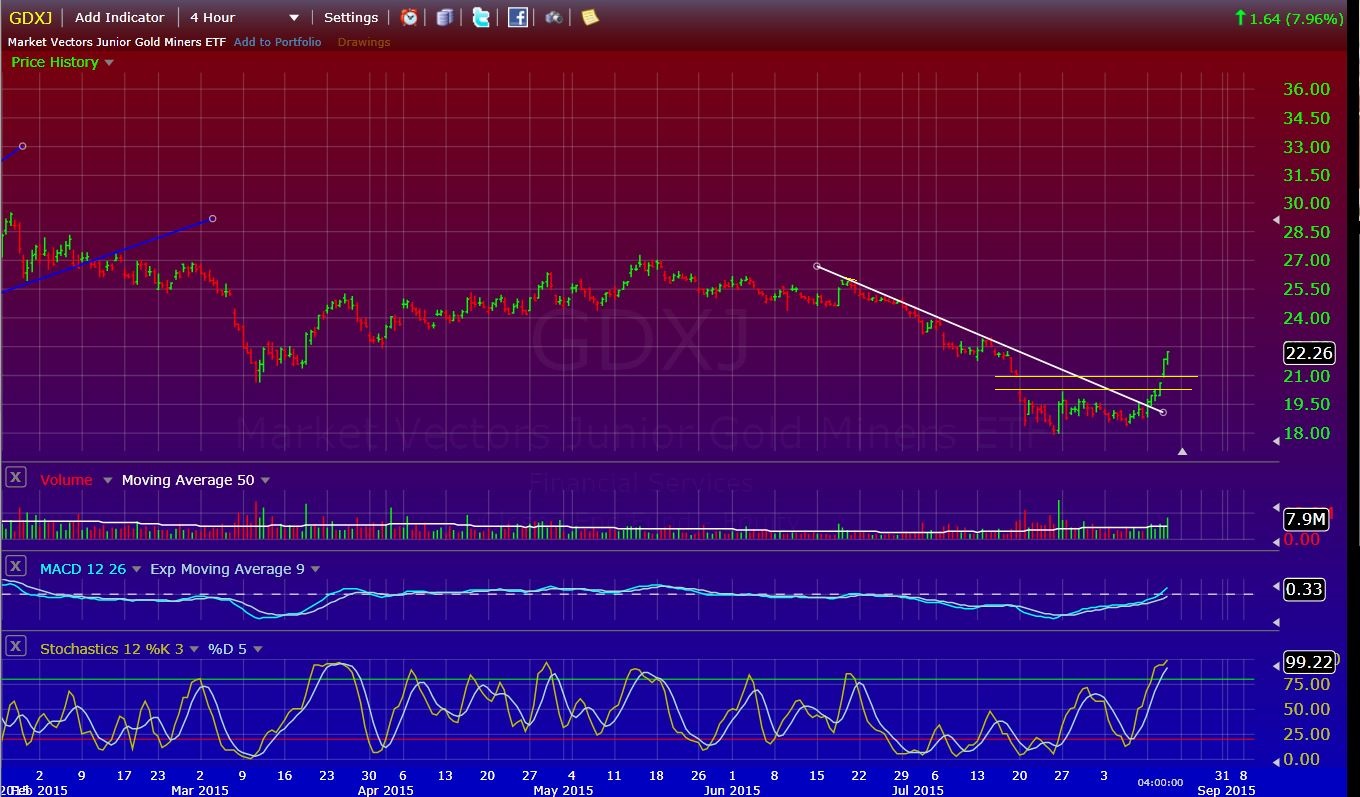
GDXJ– Some thought we should ‘sell at the gap ‘, but GDXJ extended higher. It is at resistance, it may pause, pullback, or surge higher.
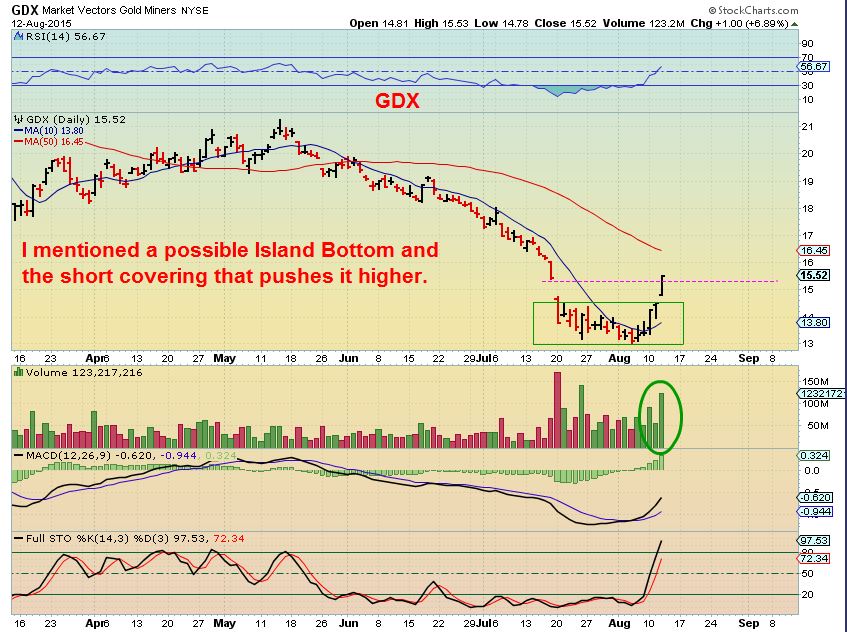
GDX – also extended into the close. Short covering could carry the rally further. GDX appears to only be on day 5, but…
GDXJ is at resistance with the 50sma and the Bollinger Band break, and appears to be on day 13? I possibly would have told you to sell yesterday if I was teaching a day trading course, but I am not doing that here. We may not drop very much.
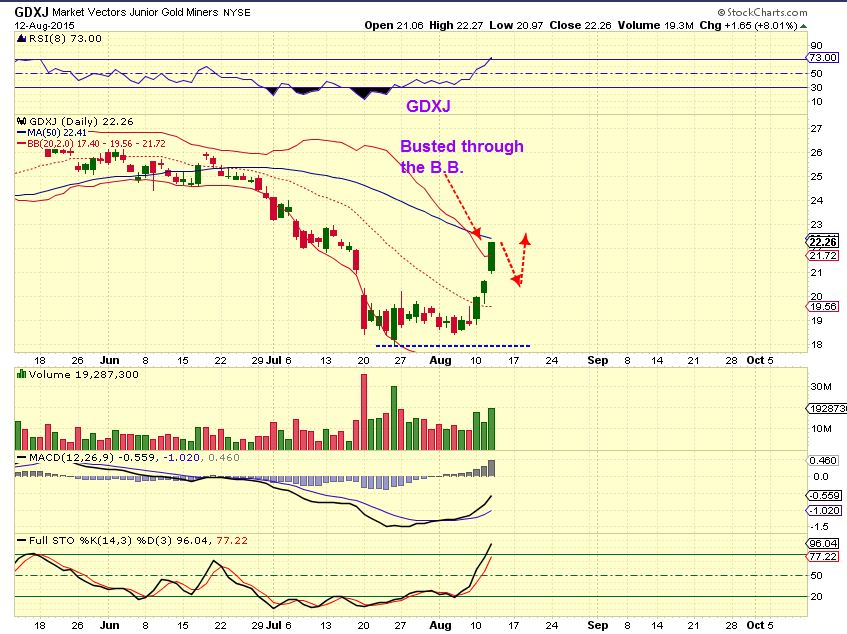
If I was teaching a day trading course, I may have pointed this out on a 4 hr chart as a sell also, but for now we could still go sideways or higher too.
GDXJ 4 hr. Strong move
Conclusion:
SO I hope everyone understands what I am saying here. We got in near the lows. The target from here is really a time frame. We should rally for the next 6-8 weeks or so, and the second daily cycle may be the top. You may trade as you like, but I am looking at a time frame. ( Leveraged positions should be traded however, and if you are using them, you need to research them & understand how the decay works). There is a possibility that we just nailed THE BOTTOM of the bear market , but we wont know that until later. I will be watching various things as we move forward to identify where we might be at that time. Not only do all bottoms look different, the rallies moving out of them are all different too. I have shown you various styles and some are very difficult to trade or micromanage, I am not here to teach a day trading course. THERE WILL BE PULLBACKS. I know that we have experienced traders here and you can trade this daily cycle as you see fit 🙂
It is also important to remember that various Miners all move at their own rate. Look at SA right now, a little rocket ship! Remember when GDX ran up in NOV 2014 for 14 days and then dropped right back down to the lows? CDE did NOT drop back down to lows, in fact it doubled from the Nov Lows, so selling that miner in the 1st daily cycle would not have worked.
I also see that OIL & possibly NATGAS look ready to move higher, and some may be looking at OIL stock too. We’ve already seen some big moves out of the Energy lows. I will try to just offer some good trade opportunities or entries when these set ups arise. During this run, some of the Miners will likely sell off, so we will look for set ups to get in at the lower prices too.
THIS WILL NOT BE AN EASY RIDE, it never is when money and emotions are involved, but this really should be a time when we can make some nice profits. I look forward to the next few weeks!


What a great discussion Alex. You went through all the things I’ve been thinking about in terms of possible scenarios and the difficulty that arises in trying to trade the wiggles. Time indeed is the key, and deciding how much risk you should/can take and therefore how big a position can you sleep with if we pull way back, as at the end of last year.
You just mentioned what I meant to put in my conclusion along with ‘Options’…Position size is important to peoples emotions. And scaling in on dips and out on rallys may help some along the way. Thx.
The time component was great! Helps with options timing AND with my small cap mining shares – buy the dip to add UNTIL….(unless we really get a trend change). So I’ll be in and out of some positions (levered) but holding regular 1x shares. Oh, and I read ALL of the text (always do).
BAA getting spanked a bit on earnings. Opportunity?
Man, they had record revenue of 42 million in the 2nd Quarter, 62% increase form last yr . Sounds great, I need to read more to see why the sell off.
I think they are stinking in cost containment. AIC per once is north of 1100, but it is a gtreat deposit and the price for the moment looks right.
On the surface the report looks good. I’d think it’s a buying opportunity. Their cost is high but I don’t think that was a surprise.
I didn’t listen to the conference call so don’t know if there was anything interesting mentioned that would effect price.
I would add the excellent quote I saw on Twitter recently – I don’t sell on profits, I sell on exits.
Good to have a trading plan.
My exit is 2+ months – – – (Well, as a trader, I’m sure I’ll have a few exits on the way 🙂
Yeah the exit specified by time? Price seems better.
I just wanted to share this with everyone. (refresh) This is 9:45 A.M. Eastern Time https://uploads.disquscdn.com/images/cebe72bf7b46b4092a48f84119311bc278e3aa30ab0f77569946603073741e66.jpg
Thanks, nice look.
https://uploads.disquscdn.com/images/0689e54b38266898dd8090344a0770be34d0eed4b70d83f0d51082f33fb6ee07.png
Your trendline also runs together with the 50 EMA & 50 SMA
I like your GREEN arrow 🙂
🙂
sweetness …..
A couple of weeks ago, I mentioned turning off the computer and going to the gym – I’m back! Things do indeed look better now. Yesterday, I sold OTM covered calls on all GDX & GDXJ – now the trick will be to nimbly buy them back before the next leg higher. Alex, you absolutely DELIVER on putting in time & effort on your analysis – you give the best value for the subscription dollar out there.
Welcome back & Thank you for that, Cal ( tell your friends 🙂
And you must be HUGE hiding in the gym for the last couple of weeks!
You guys watching WTI Crude? Almost at a double bottom $42
Morning!
my little BAA is suffering today.
update on your favorite miners (refresh)
Another great call by you on SUNE! 10% keep it coming
glad you’re riding it!
how about ATLS for a swing trade?
Value investor Leon Cooperman doubled down on his stake (20% in ATLS)
Didn’t take the trade. Not high on the markets right now. But good call anyway.
EPS is negative, Technically it looks good.
Shorted SUNE today
Alex, when would you expect a break higher out of a Cup and Handle pattern. Refresh for GURE
I like the pattern and its something that just needs to be watched for the break . You dont want it to drop lower than 1/2 way down the cup though, or the slant is showing a bit too much weakness.
So far so good I’d say
P.S> that handle tagged the 200sma on a daily
full disclosure. Bought NUGT puts (today) and GLD puts (yesterday). Still long individual miners.
puts are short term as hedge. (careful with options)
Nice work with the hedges. I often do that but didn’t this time. Sold half of GDX calls yesterday though today least lock that profit in.
Alex great report !
GDX in the last 5 days is Up 19% the highest increase in 5 Years for that time period…..Pullbacks need to be Expected !
Agree, and we have traders here that will play both sides of this as much as they can. For the rest ? Ride the rips and buy the dips, until its broken.
What is XEL, CVI , ALJ and EOG trying to tell us? Is it time to buy energy?
You would think we would be close Bill. On day 59 in the daily cycle as stated above. Maybe wait for a daily buy signal in crude to add to the basket of stocks ?
REXX and LGCY rose up 70% and 40% off of their lows already
Amazing with crude dropping. LGCY badly missed earnings too? Probably want to pick a laggard not a POP. I’m looking at PEIX, ANW, PACD
that little ZBB is jusssst about ripe for the pickn as well …
I like ZBB. Thanks for the reminder!
ZBB, maybe as a AB=CD bull flag forming? Could be a double from here, BUT Crude has to rebound
somethin in the neighborhoooood of ….. this perhaps??
https://www.tradingview.com/x/hd6jSel1/
https://www.tradingview.com/chart/ZBB/EZiN6tNP-ZBB/
That’s about what I have. Maria
Lower Low in Crude Oil today on day 59 !
Yeah. I tried but was too early, stopped out this morning.
Gold & Silver EWs for junkies.
maybe gold back to 10sMA? … it would satisfy a 4 wave correction to a parallel lower trend line.
https://uploads.disquscdn.com/images/5614854be2ecfc7ca09edda9296eb2992605868a1d11ad6b2e61bc3a84fe30dd.jpg https://uploads.disquscdn.com/images/a3d5286f2426c70697765598a7a10547083f09d751664074df702b5f68d9e769.jpg
nice……..
the trend is down. (refresh)
Agree Frenchy (blame Maria! 🙂 )
Disclaimer: I am short the Market via VIX calls.
good. I’ve been waiting for a couple of up days in a row to buy INDU dec puts.
;o)
Glad I sold all NUGT in the A/H last night. Hope no one on this board bought it. Will be looking to re-enter, but not till dollar falls again. Nice profit thanks to CF. Still swing trading GILD with success.
Stopped out UWTI (loss). Stopped out GLD calls (solid profit). Added TQQQ yesterday on reversal (for diversity). Added back a few GDX calls at AM lows (but way less # than I sold), hoping we ride back up Fri or Mon, will sell all in next rip and re-assess.
Oil wasn’t ready, maybe soon? Gas getting crushed. Latest breakout to get burned by inventory!
Wow , I didnt see NATGAS down 4%, since I wasnt trading it ! . I would say that was a false break out higher out of that triangle
.
Actually , looking at my chart in the report, That may just be a back test of the break out?
I’d say right as planned. Refresh! Before and After, now look for $1.85 to get back long.
GDX landing area $14.5
ok sit down…(and stop laughing) ;o) but here’s what I cooked up in the catcave for a possssssibility for Gold….
https://www.tradingview.com/x/sss2U57r/
Nice. The priestess has spoken.
Can you draw /CL?
mayyybe…. what will ya give me…?? (she’s asked coyly tipping her head ever so slightly to the right)……. ;o)
Champagne Madame!
… I’ll see what i can cookup….. 😉
Sounds like a plan.
The 1145-1150 area – the breakdown level – should be a greater resistance zone.
Some bulls who survived the massacre and tried to long from there before that Monday morning (20th July) will close their longs to get rid of the position. Also some bear who started to short from there before the breakdown – and didn’t take profit at 1070 – also will close the trade there. I thought that would be the 1st stop in this rally. I don’t understand this level where we are now.
ps. i should add my disclaimer for those who are new … “i am a novice ..annnnd could be making this all up” ;o)
M, you ever thought of joining Elliotolics Anonymous?
its a (5-3-5) step plan to health.
though you will likely need the (5-3-5-3-5) step plan.
ha ha ha… oh my gosh.. u guys CRACK me up!
ps. yes i have actually…. yesterday, i nearly fell over dead watching the candles paint PERFECTLY into the close … which i must confess I sold in anticipation of this lovely correction wave painting as we speak…
🙂
good move selling yesterday… you got more faith in EW than me!
i didnt sell.. not a fast turnaround trader anyway, like you lot are…
i would lose too much on churn, not getting back in again soon enough.
will some add more when i get afeeling this wave 4 is done (just you keep posting them updated charts)
pss. it’s not ‘faith’ .. i am just studying the candles…impulse –> correction; impulse–> correction…& so on it goes…luckily for us ;o)
well ya know what i mean… faith in any particular interpretation you might happen to have projected onto the developing wave up to that point.
… gotcha…
thanx “bing”
let it be said as gospel tho’, that wave 4 ‘must’ leave wave 3 channel (if complete).
silver already has… gold is toying with the idea
silver…. ahhh.. that’s another story … now THIS blows my mind….
https://www.tradingview.com/x/Cu1gc5W9/
wave A of the wave 4 correction?
looks textbook perfect!
1 diagonal overlapper
2 z/z
3 impulse
4 triangle
5 impulse
so buy silver… right? lol
https://www.tradingview.com/x/cw0lTfRF/
where’s kenny boy? giggle
weell if its going up there…ok count me in
NUGT about to drop under $4.
It wants down with a vengeance today. Looking to get back in, but not at the moment.
-25% potential target.
maybe not this much. $14.5 area for GDX
Not as fantastic today (refresh)
Ratio giving itself a breather
(refresh)
The hourly chart in gold is quite similar to the 2014. June situation…. https://uploads.disquscdn.com/images/dca5b2b5045eac88422fda652b08cbe9b074527c4e8f34dd334bfb3c3731e966.png