I have to be honest, I was recently looking at the markets and thinking that the apparent weakness was going to prevail. Recently I’ve been staring at the SOX and something is starting to pop out at me. let me explain…
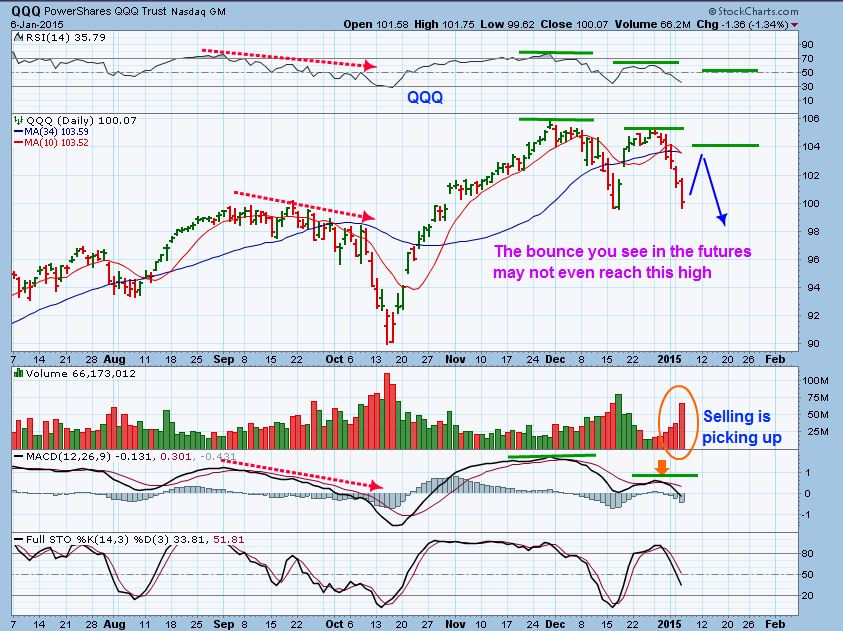
I had mentioned to my readers back in DEC that I thought I saw internal weakness in the markets. As the markets began to weakly bounce & Roll over, I then posted this chart JAN 6 and mentioned that though I expect a bounce here, I thought we may ‘fail ” at the 50sma. BUY THE DIPS might not work, and possibly a short set up .
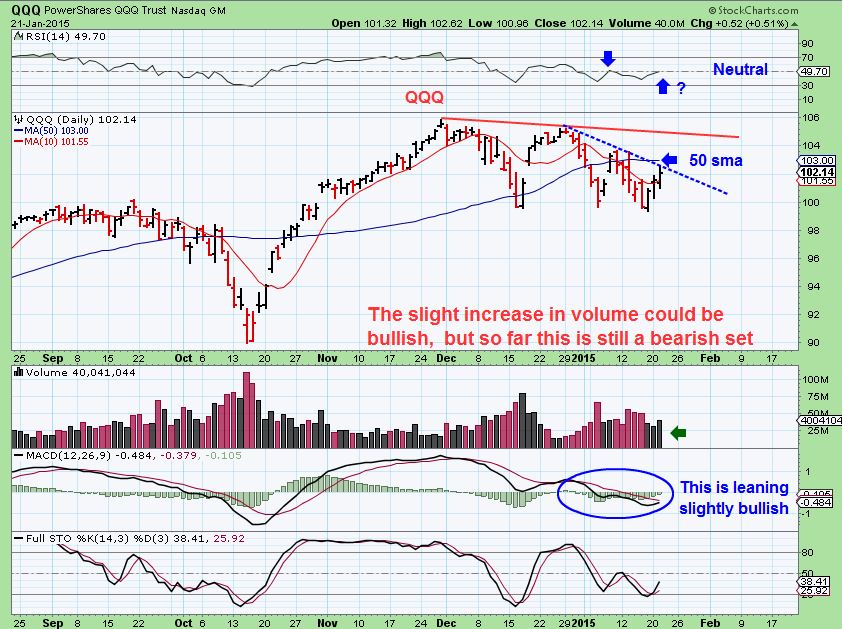
By Jan 21 the weak bounce had played out, I began to think we may get a good shorting opportunity, but wait for that ECB mtg.
But then I saw those SOCKS! No, not the multi colored array of Socks above, I mean …
The SOX – The Semi-conductor index. It started looking a little more bullish well before the ECB mtg, so I looked inside and mentioned in 1 report that CREE actually looks like a bullish set up. This was
CREE (Jan 20)
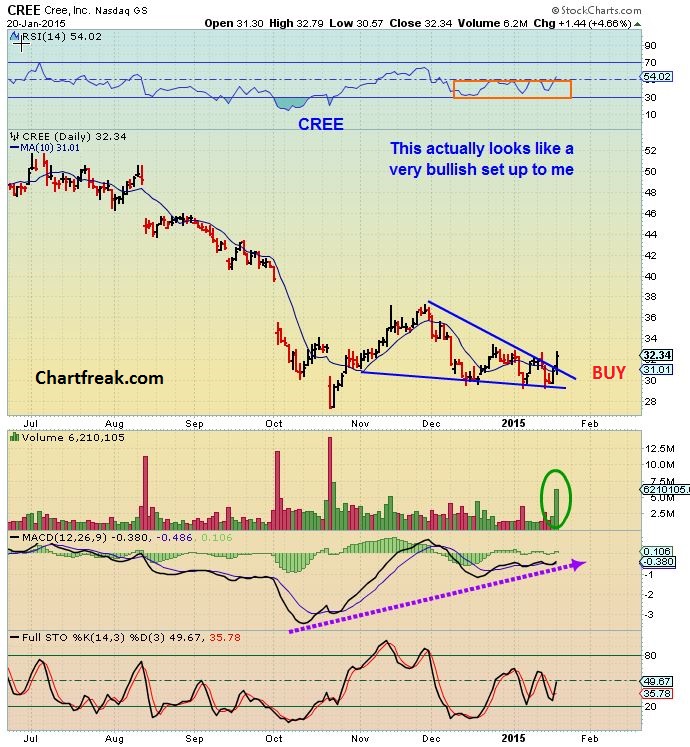
A couple of my readers actually took the trade and mentioned that it worked out nicely.
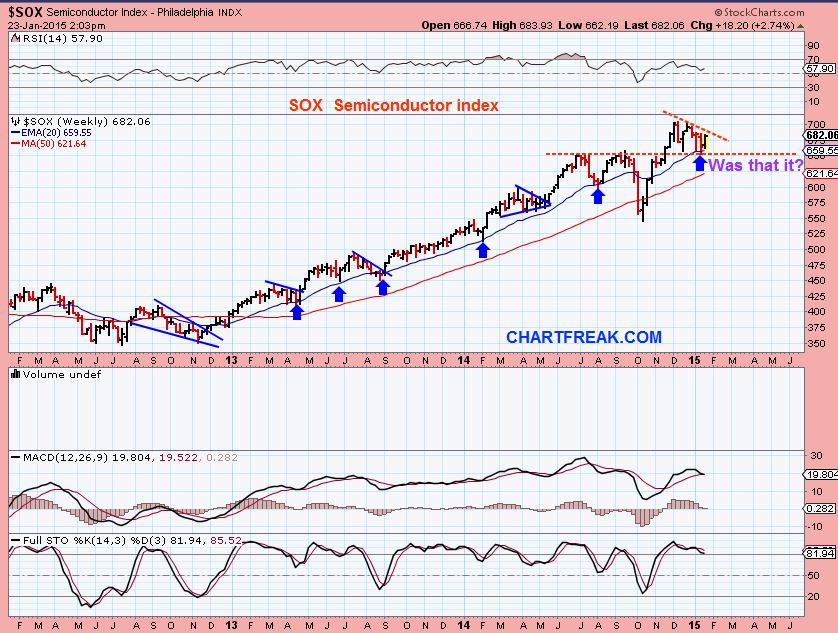
I told my readers on Wednesday ( The day before DRAGHI ‘s ECB MTG ) , that the charts were now showing signs of bullishness. I posted this pre-mkt yesterday to show that the 3 Q’s were leaning a little more to the bullish side. I’d be watching the 50sma and the blue trendline.
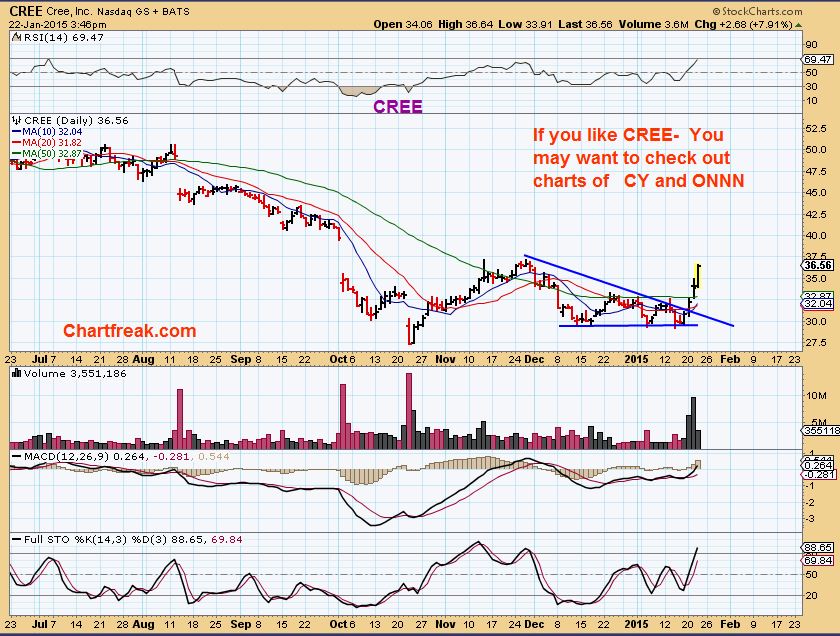
The markets shot up higher after that ECB mtg report came out. SO I thought, “Was the semi conductor sector leading a bullish move here? ” I began to look into a few other charts . This is just a couple of charts that I came up with under that sector.
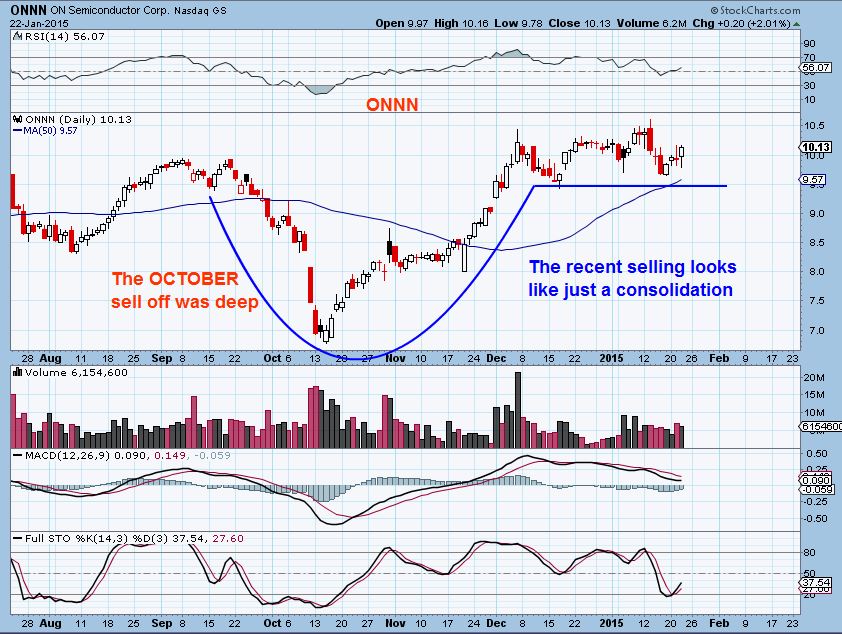
ONNN – Bullish set up
CY – Doesnt it look like it’s breaking out? I would have bought the tag of the bottom orange line, and I still could if we drop to test the 50sma , right??
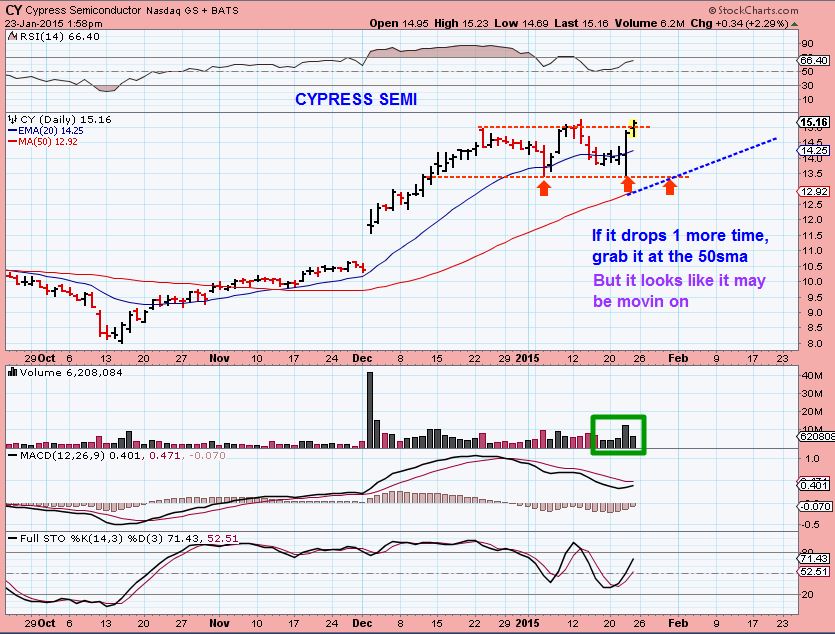
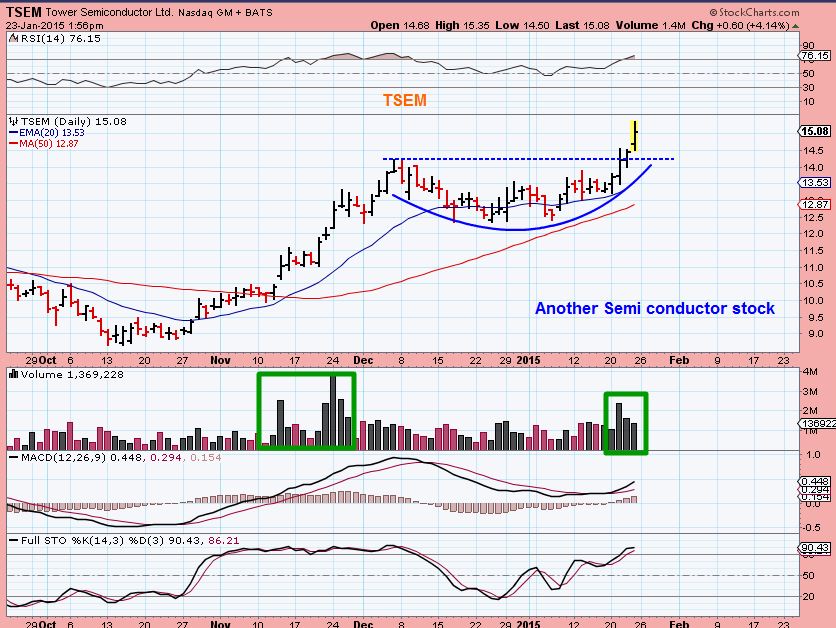
MAYBE / MAYBE NOT. I looked at another semi conductor stock today and it is breaking out. There may not be another chance to buy CY down at that orange line, but those who buy break outs may have a few choices in this sector.
This is TSEM – pretty ( However, the weekly indicates to me that this break out will be tested soon. )
Yes , thats right, those beautiful multi colored SOX may be setting up to break out higher. A pullback to the 20WMA is very common , as you can see here.
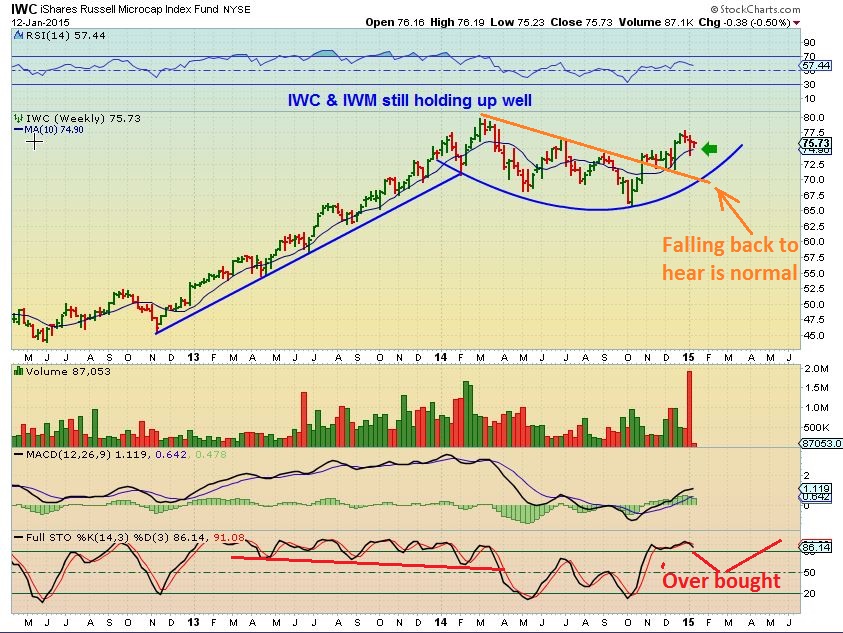
Something I’ve had my eyes on for a while now is that even though the QQQ, SPX , etc started looking weak in their sideways moves, I have thought that the Small Caps and micro Caps might be a great place to be as 1015 moves forward. I used several charts to show why, and this one from JAN 12 is just one of the many.
At Chartfreak.Com we have been mainly invested in Metals and Miners through Dec and Jan, as noted in other public reports posted here under the “BLOG” tabs here . They have had a great run up, but when they rest and consolidate gains, it gives me time to look at other areas and see if there are any “Set ups” forming. After all, we dont really want to Marry out investments, just try to profit from some of the moves higher and search for another profitable trade.
Sometimes it takes patience, and you’ll see that as the headline of a recent report under the ‘strategies’ tab. It may take time for a few good low risk set ups to form, but patience can be rewarding . I think ENERGY may be one of those areas that some low risk set ups may be found soon. In fact, I have to wonder….Is the SOX set up now? Are the equity markets set up for another bull run? Could it still be weak and just be a double top coming up? What about OIL, NATGAS, and Energy? The recent weakness raises many questions with me, and I’ll be looking into the charts further this weekend and in the weeks to come to see how things develop.
Thanks for stopping in and reading along. Best Wishes to you and happy trading!
~Alex
Pass The Draghi Juice Please 
 I Want To Emphasize Caution
Scroll to top

We still should remain suspicious of this rally in S&P. The upward pattern has many overlaps. This is consistent with a correction. Maybe a B wave and possibly a dia. tri. 5th wave. Patterns such as these are often completely retraced, so bulls should be cautious go forward. Also note a possible H&S on the daily with double shoulders on each side of the head. Head was made on Dec. 29, 2014. Early to say a H&S will materialize but we should keep a close eye on it. If triggered, it projects to 1870ish SPX. Good luck to all of us.
I agree GN. I have actually leaned to the more bearish side since December, and the 1 day Draghi juice didnt really change my mind, but there are signs of strength in some areas, weakness in others even now. Outwardly it looks to be recovering, but inside there are still signs of weakness. Thanks for reading along and thanks for the comment!
Well I like the pair of socks in the middle !
Hello Alex,
Curious your buildout on miner indexes. Seems at least europeans are buying gold. Incredible support in euros as dollar accelerates.
Curious your construct on the miners’ indexes to consider over the weekend for next weeks reference. Sure seem ‘well priced’ in GDX:GLD, buy the dip, terms. Daily GDX expressing a nice channel since Xmas.
Hi Beek, The socks in the middle huh? I’m going to guess that you grew up on Juicy Fruit Gum? 🙂
I’ll cover the rest in the weekend report, I know you are a premium reader. Thx
Nah, just refects the wonderful color scheme in your charting,
from skitown USA
( 🙂